Dow Jones Industrial Average falls as Middle East tensions rise
- The Dow Jones Industrial Average shed weight on Tuesday, receding below 42,500.
- Geopolitical tensions took center stage again as the Israel-Iran conflict accelerates.
- US Retail Sales took a nosedive in May, falling nearly a full percent from the previous month.

The Dow Jones Industrial Average (DJIA) lost some ground on Tuesday, declining below 42,500 as equity markets roil beneath the weight of the burgeoning Israel-Iran conflict. President Donald Trump is racing toward direct involvement in the altercation, a move that could further destabilize the region. Retail Sales data also contracted sharply in May, with Tuesday’s data release showing nearly a full percentage decline in American retail shopping volumes.
Donald Trump, posting on social media Tuesday, declared that he wants an “UNCONDITIONAL SURRENDER” from Iranian supreme leader Ali Khamenei, and announced that American military assets were moving into the Middle East conflict region. The escalation between Israel and Iran, on top of Trump’s decision to further involve American military assets and personnel, has investors on edge as their previous hopes for a quick resolution wither on the vine. The Trump administration has a poor track record for successfully resolving geopolitical issues, both internal and external, despite the Trump team’s insistence on getting involved structurally in complex issues both at home and abroad.
US data, Middle East tensions kick equities lower
Adding further downside pressure to equities, Retail Sales figures for the month of May contracted sharply, falling 0.9% MoM as consumer spending continues to slow. It is the second time this year that aggregated Retail Sales figures have contracted nearly a full percent, and previous data also saw downside revisions. While Retail Sales data doesn’t carry the market-moving weight of other key indicators, such as inflation or net monthly job gains, it is still a key factor that the Federal Reserve (Fed) weighs when considering interest rate adjustments.
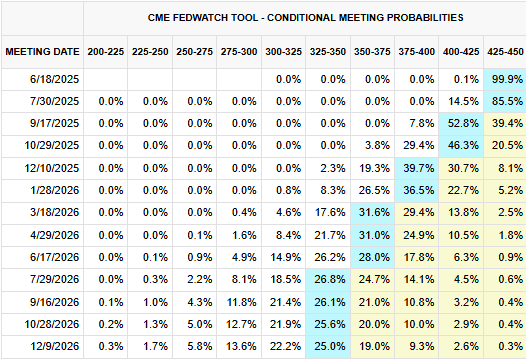
May’s Retail Sales miss is poorly timed: the Fed is set to deliver its latest interest rate call on Wednesday, and markets have already priced in another flat rate decision. Broad-market bets for the next Fed rate cut are still holding out for a September rate trim; however, odds of at least a quarter-point cut have declined to nearly 50% this week.
Read more stock news: US stock market cedes ground on Tuesday, but Chevron stock rallies on higher oil prices
Dow Jones price forecast
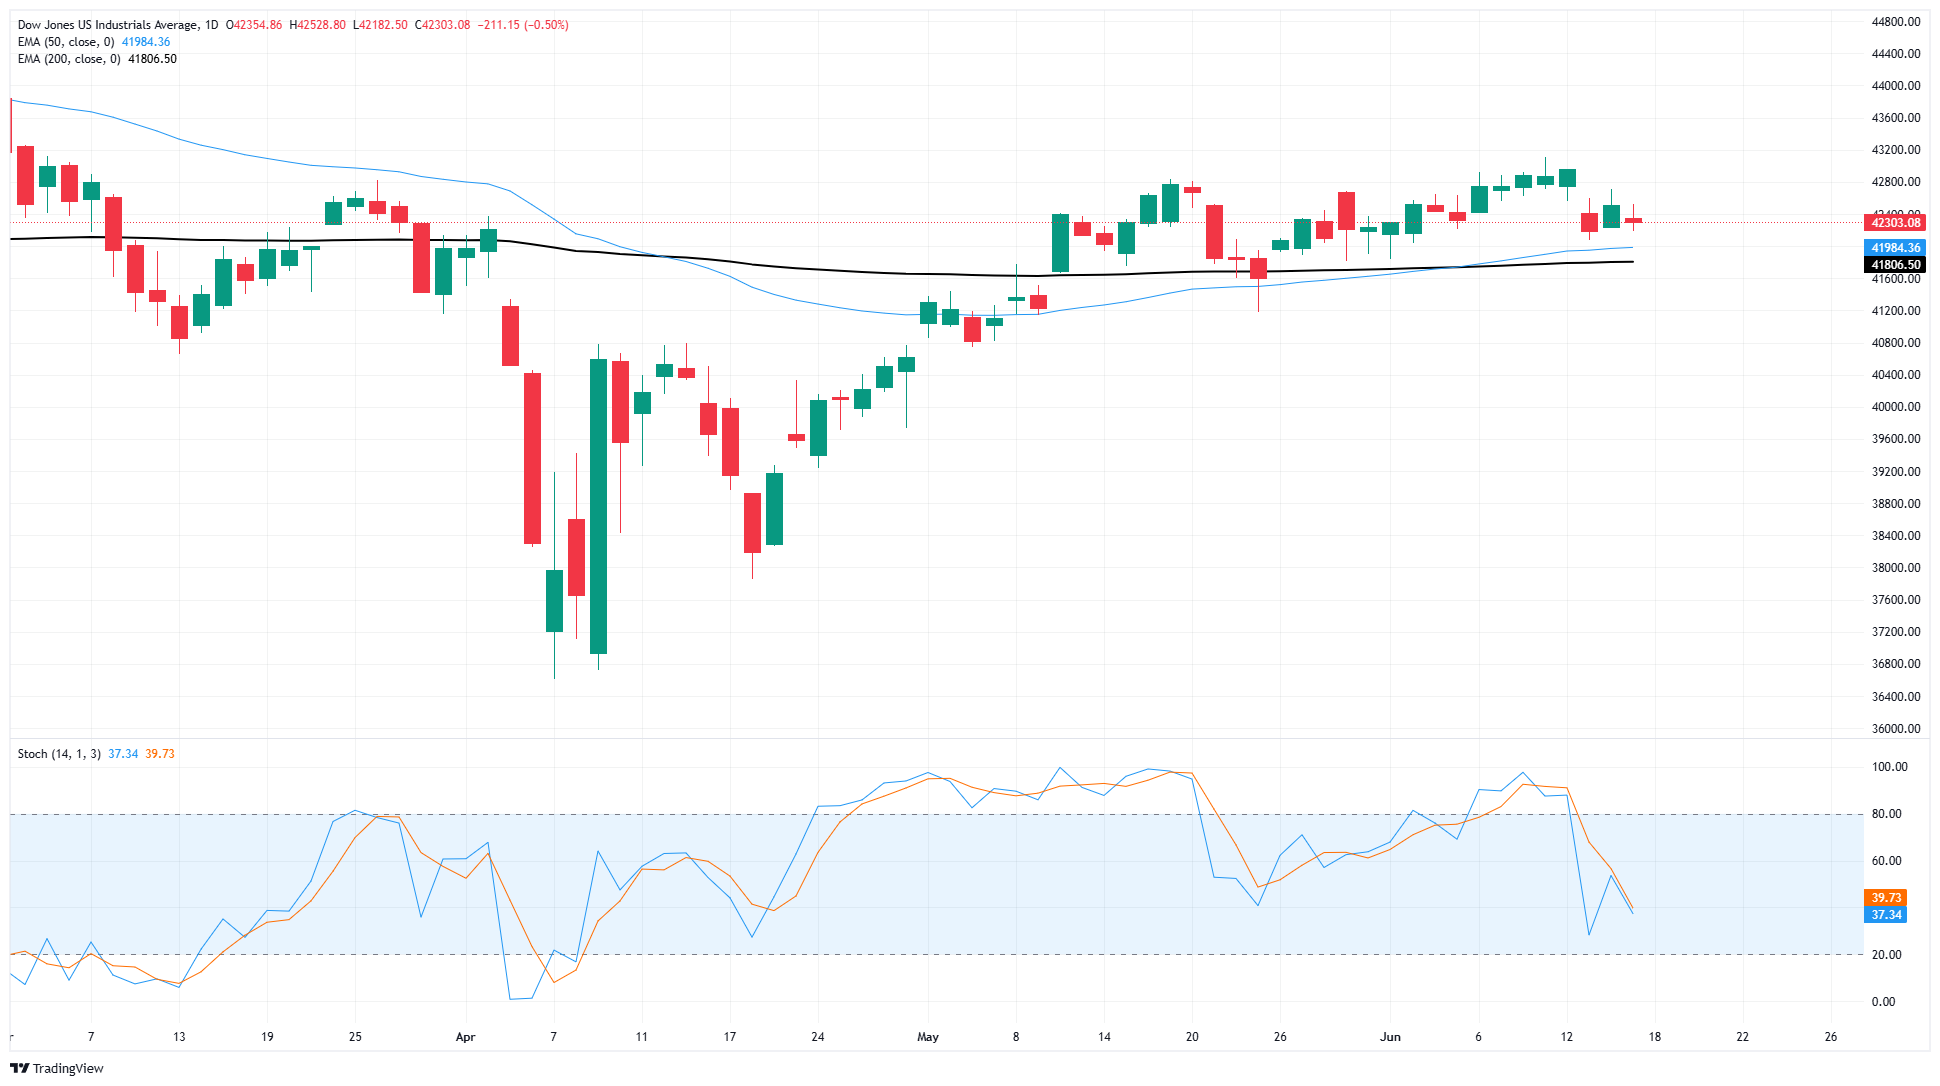
The Dow Jones Industrial Average failed to hang onto the week’s early bullish tilt, and the major equity index has slipped back below 42,50. The Dow Jones remains embroiled in a consolidation zone that has plagued the Dow boards since mid-May.
The Dow Jones found fresh peaks north of the 43,000 major price handle last week before Middle East headlines knocked investor sentiment lower, taking DJIA bids with it. The Dow still has a major technical floor priced in from the 200-day Exponential Moving Average (EMA) near 41,800, and the 50-day EMA is in the process of confirming a bullish cross of the long-run moving average.
Dow Jones daily chart
Dow Jones FAQs
The Dow Jones Industrial Average, one of the oldest stock market indices in the world, is compiled of the 30 most traded stocks in the US. The index is price-weighted rather than weighted by capitalization. It is calculated by summing the prices of the constituent stocks and dividing them by a factor, currently 0.152. The index was founded by Charles Dow, who also founded the Wall Street Journal. In later years it has been criticized for not being broadly representative enough because it only tracks 30 conglomerates, unlike broader indices such as the S&P 500.
Many different factors drive the Dow Jones Industrial Average (DJIA). The aggregate performance of the component companies revealed in quarterly company earnings reports is the main one. US and global macroeconomic data also contributes as it impacts on investor sentiment. The level of interest rates, set by the Federal Reserve (Fed), also influences the DJIA as it affects the cost of credit, on which many corporations are heavily reliant. Therefore, inflation can be a major driver as well as other metrics which impact the Fed decisions.
Dow Theory is a method for identifying the primary trend of the stock market developed by Charles Dow. A key step is to compare the direction of the Dow Jones Industrial Average (DJIA) and the Dow Jones Transportation Average (DJTA) and only follow trends where both are moving in the same direction. Volume is a confirmatory criteria. The theory uses elements of peak and trough analysis. Dow’s theory posits three trend phases: accumulation, when smart money starts buying or selling; public participation, when the wider public joins in; and distribution, when the smart money exits.
There are a number of ways to trade the DJIA. One is to use ETFs which allow investors to trade the DJIA as a single security, rather than having to buy shares in all 30 constituent companies. A leading example is the SPDR Dow Jones Industrial Average ETF (DIA). DJIA futures contracts enable traders to speculate on the future value of the index and Options provide the right, but not the obligation, to buy or sell the index at a predetermined price in the future. Mutual funds enable investors to buy a share of a diversified portfolio of DJIA stocks thus providing exposure to the overall index.
Author

Joshua Gibson
FXStreet
Joshua joins the FXStreet team as an Economics and Finance double major from Vancouver Island University with twelve years' experience as an independent trader focusing on technical analysis.


