Dow Jones Elliott Wave technical analysis [Video]
![Dow Jones Elliott Wave technical analysis [Video]](https://editorial.fxstreet.com/images/Markets/Equities/DowJones/yahoo-finance-web-pages-on-apple-ipad-16477994_XtraLarge.jpg)
DJI Elliott Wave technical analysis
-
Function: Counter-Trend.
-
Mode: Corrective.
-
Structure: Orange Wave B.
-
Position: Navy Blue Wave 4.
-
Direction next lower degrees: Orange Wave C.
Details
- Current Status: Orange wave A of navy blue wave 4 appears complete, with orange wave B currently unfolding.
- Invalidation Level: 45,105.16
Analysis summary
The Dow Jones Industrial Average (DJI) is undergoing a counter-trend corrective phase, as shown by Elliott Wave Analysis on the daily chart. This phase focuses on orange wave B, which is part of the broader navy blue wave 4 corrective sequence.
- The completion of orange wave A marks the start of orange wave B, which is actively progressing and represents a temporary retracement or adjustment within the overall market cycle.
- Following orange wave B, the next anticipated move is into orange wave C, further advancing the corrective phase of navy blue wave 4.
These corrective waves indicate a period of consolidation and short-term fluctuations before the market resumes its broader trend.
Invalidation level
- The invalidation threshold is set at 45,105.16.
- Any movement beyond this level would invalidate the current wave structure and require reevaluation of the analysis.
- This level serves as a critical benchmark to confirm or dismiss the ongoing wave count.
Conclusion
The Dow Jones is navigating a corrective stage within the broader wave structure, with orange wave B of navy blue wave 4 currently in progress. This phase highlights short-term market adjustments before transitioning into orange wave C. The invalidation level at 45,105.16 is essential for maintaining the Elliott Wave analysis's accuracy and preparing for the next significant market moves.
.png.1173c70134a5f46b635a30b66053012b.png)
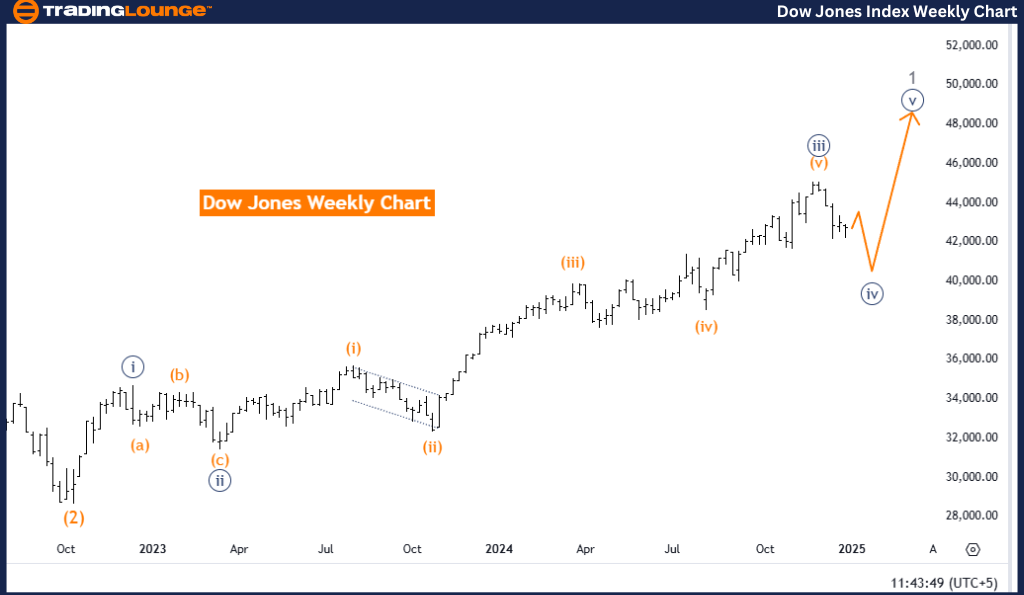
DJI weekly chart: Elliott Wave analysis
-
Function: Counter-Trend.
-
Mode: Corrective.
-
Structure: Navy Blue Wave 4.
-
Position: Gray Wave 1.
-
Direction next higher degrees: Navy Blue Wave 5.
Details
- Current Status: Navy blue wave 3 appears complete, with navy blue wave 4 now actively unfolding.
Analysis summary
The Dow Jones Industrial Average (DJI) is in a counter-trend corrective phase on the weekly chart, as per Elliott Wave Analysis. This phase corresponds to navy blue wave 4, part of the broader wave sequence.
- Navy blue wave 3 has concluded, signaling the onset of navy blue wave 4, a corrective stage within the overall upward trend.
- This corrective phase acts as a temporary retracement or pause before the resumption of upward momentum with navy blue wave 5.
Larger context
- The transition from wave 3 to wave 4 is a typical feature of the Elliott Wave framework, reflecting short-term market fluctuations within the larger trend.
- Navy blue wave 5 is expected to follow once wave 4 completes, continuing the broader bullish trajectory.
Significance of current phase
- Understanding the corrective phase of navy blue wave 4 is critical for anticipating potential market behavior.
- This phase offers an opportunity for traders and investors to prepare for the next directional move as the market gears up for navy blue wave 5.
Conclusion
The Dow Jones is navigating a corrective phase within the larger trend cycle, transitioning from navy blue wave 3 to navy blue wave 4. This stage represents a temporary pause before the expected continuation of the upward trend with wave 5. Market participants can utilize this period to position themselves for the next significant market movement.
Dow Jones Elliott Wave technical analysis [Video]
Author

Peter Mathers
TradingLounge
Peter Mathers started actively trading in 1982. He began his career at Hoei and Shoin, a Japanese futures trading company.


