Dow Jones Elliott Wave technical analysis [Video]
![Dow Jones Elliott Wave technical analysis [Video]](https://editorial.fxstreet.com/images/Markets/Equities/DowJones/dow-jones-industrial-average-23489884.jpg)
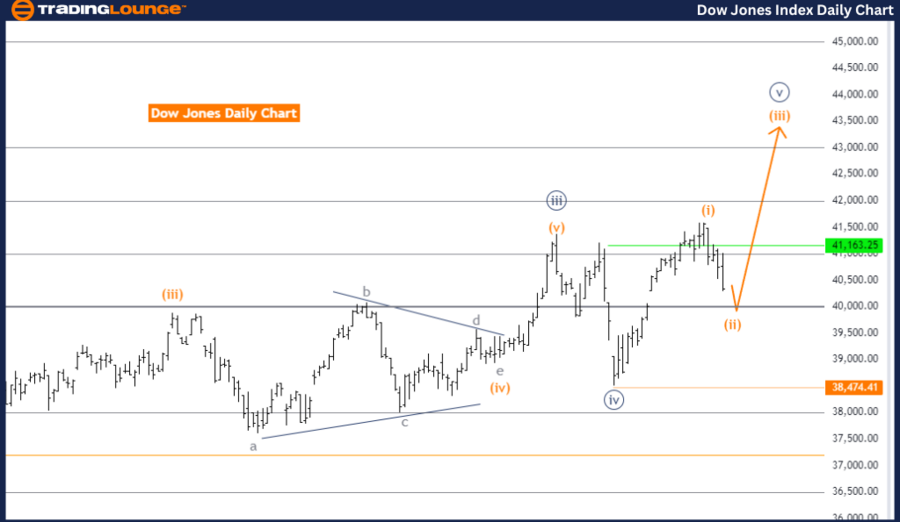
DOW JONES - DJI Elliott Wave analysis (day chart).
DJI Elliott Wave technical analysis
Function: Counter Trend.
Mode: Corrective.
Structure: Orange wave 2.
Position: Navy blue wave 5.
Next higher degree direction: Orange wave 3.
Details: Orange wave 1 appears to have completed, and now orange wave 2 is active and nearing its end. The invalidation level for wave cancellation is set at 38,474.41.
The DOW JONES (DJI) Elliott Wave Analysis on the day chart reveals a counter trend in progress, currently in a corrective phase. The primary structure under examination is orange wave 2, which is actively unfolding. Earlier, orange wave 1 was deemed complete, signaling the transition into the corrective stage of orange wave 2.
Currently, the market is positioned within navy blue wave 5, which is a part of the larger wave structure. Expectations suggest that orange wave 2 is approaching its end. Once complete, the market is likely to shift into orange wave 3. This transition implies that, after the current correction, the index could resume a more impulsive upward movement in line with the larger wave pattern.
The analysis indicates that the counter trend, which has temporarily paused the broader trend, is almost complete. The next significant move is projected to be an upward shift as the market transitions into orange wave 3. This phase is expected to continue the long-term bullish outlook for the DOW JONES index.
Key Technical Levels: The wave cancel invalidation point is set at 38,474.41. If the market drops below this level, the current Elliott Wave structure will be invalid, requiring a reevaluation of the wave count and market position.
Summary: The DOW JONES is nearing the end of a corrective phase, with orange wave 2 expected to finish soon. The next anticipated movement is the continuation of the bullish trend as orange wave 3 begins. This suggests potential upward momentum for the index following the current correction.
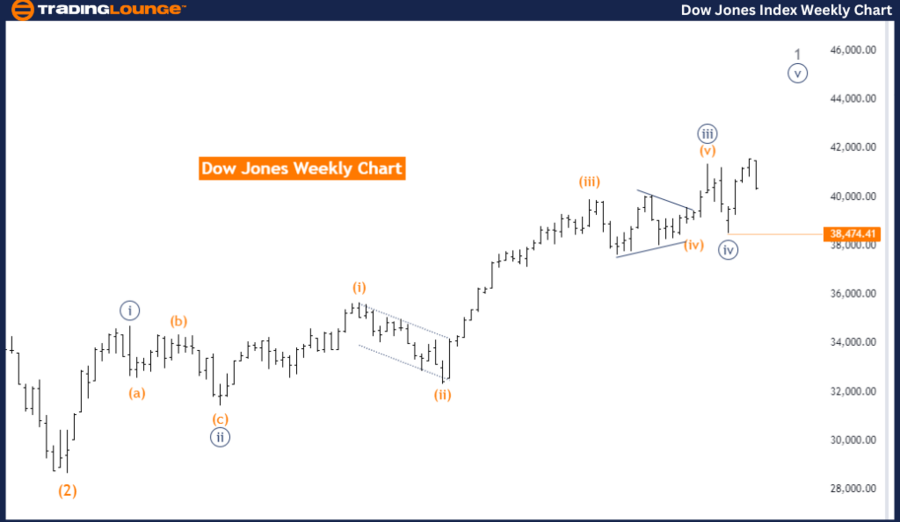
DOW JONES - DJI Elliott Wave analysis (weekly chart)
DJI Elliott Wave Technical Analysis
Function: Trend.
Mode: Impulsive.
Structure: Navy blue wave 5.
Position: Gray wave 1.
Next lower degree direction: Gray wave 2.
Details: Navy blue wave 4 appears completed, and now navy blue wave 5 is underway. The invalidation level for wave cancellation is set at 38,474.41.
The DOW JONES (DJI) Elliott Wave Technical Analysis on the weekly chart suggests that the market is in a trending phase, characterized by an impulsive mode. The primary structure is navy blue wave 5, which indicates the continuation of the upward trend, with the market currently positioned in gray wave 1. This suggests that the current upward movement is part of the larger wave structure.
Navy blue wave 4 is considered complete, and navy blue wave 5 is now unfolding. This phase points to further upward movement following the completion of wave 4. The current position within gray wave 1 signals the beginning of a new impulsive wave, though gray wave 2, a corrective phase, is expected to follow after the current upward movement. The anticipated gray wave 2 will bring a temporary correction before the potential resumption of the bullish trend.
The analysis identifies a key invalidation level at 38,474.41. If the market drops below this point, the current Elliott Wave structure would be invalid, requiring a reassessment of the wave count and market outlook. However, as long as the market stays above this level, the upward trend within navy blue wave 5 is likely to continue.
Summary: The DOW JONES index is in a bullish trend, currently moving within navy blue wave 5, following the completion of wave 4. The market is positioned in gray wave 1, with gray wave 2 expected to follow as a corrective phase. The invalidation level is 38,474.41, and remaining above this level supports the continuation of the upward trend.
Dow Jones Elliott Wave technical analysis [Video]
Author

Peter Mathers
TradingLounge
Peter Mathers started actively trading in 1982. He began his career at Hoei and Shoin, a Japanese futures trading company.


