Dow Jones DJI Index Elliott Wave technical analysis [Video]
![Dow Jones DJI Index Elliott Wave technical analysis [Video]](https://editorial.fxstreet.com/images/Markets/Equities/DowJones/bloomberg-app-on-iphone-4-with-market-data-17118657.jpg)
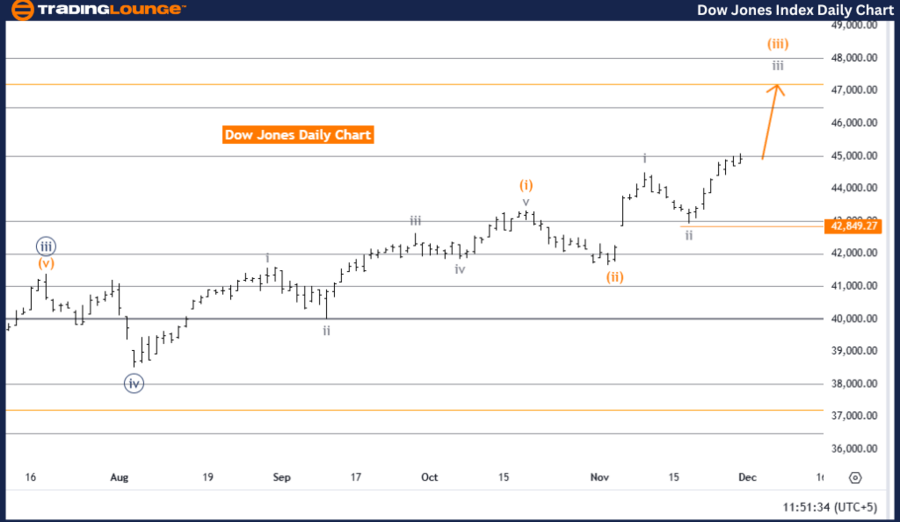
DOW JONES (DJI) Elliott Wave Analysis: Daily Chart.
DJI Elliott Wave technical analysis
-
Function: Bullish Trend.
-
Mode: Impulsive.
-
Structure: Gray Wave 3.
-
Position: Orange Wave 3.
-
Next lower degree direction: Gray Wave 4.
-
Details: Gray wave 2 appears complete, and gray wave 3 is currently in progress.
-
Wave cancel invalidation level: 42,849.27.
Analysis overview
The Dow Jones Industrial Average (DJI) is exhibiting a bullish trend, as indicated by Elliott Wave analysis. The market is currently in an impulsive mode, signaling strong upward momentum and an expansion phase. The structure being tracked is gray wave 3, which represents a robust upward push following the completion of gray wave 2.
Key observations:
-
Wave Structure and Position:
-
The market is actively progressing in gray wave 3, which showcases a strong bullish impulse.
-
Within this context, orange wave 3 highlights an acceleration phase, emphasizing the continuation of upward momentum.
-
-
Future Movements:
-
After the conclusion of gray wave 3, a corrective gray wave 4 is expected as part of the lower-degree wave sequence.
-
-
Risk Management:
-
The invalidation level is set at 42,849.27.
-
If the price drops below this level, the current wave count will be invalidated, and the analysis would require revision.
-
Conclusion
The Elliott Wave analysis for the Dow Jones on the daily chart suggests a continued bullish trend, with gray wave 3 currently unfolding. The completion of gray wave 2 has initiated this phase of upward momentum, with further gains anticipated in the short term.
Key takeaways:
-
Positive Market Outlook: The bullish trend is expected to persist as long as the price remains above 42,849.27.
-
Next Phase: After gray wave 3, the market is likely to transition into the corrective gray wave 4 phase.
This analysis underscores a favorable market outlook for the Dow Jones, providing insights for trend-following strategies and risk management.
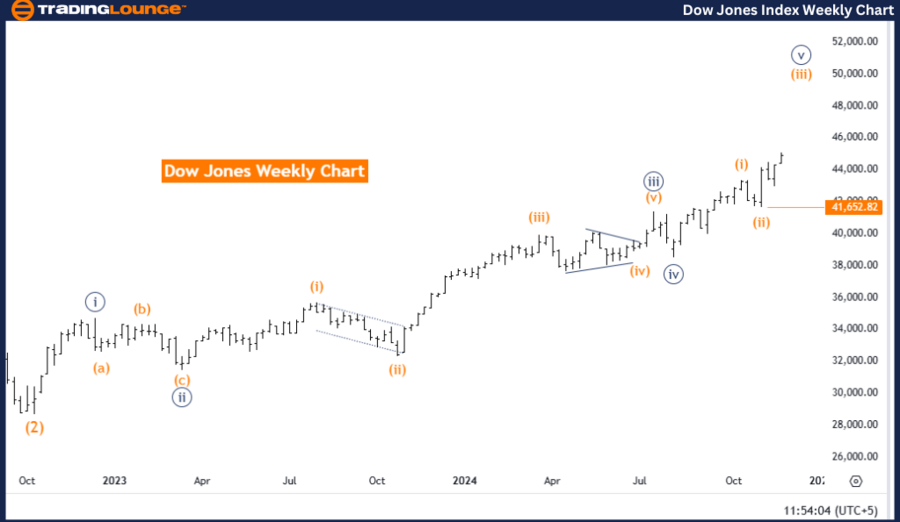
DOW JONES (DJI) Elliott Wave Analysis: Weekly Chart.
DJI Elliott Wave technical analysis
-
Function: Bullish Trend.
-
Mode: Impulsive.
-
Structure: Orange Wave 3.
-
Position: Navy Blue Wave 5.
-
Next lower degree direction: Orange Wave 4.
-
Details: Orange wave 2 appears complete, with orange wave 3 currently in progress.
-
Wave cancel invalidation level: 41,652.82.
Analysis overview
The Dow Jones Industrial Average (DJI) continues to exhibit a bullish trend on the weekly chart, as per Elliott Wave analysis. The market is in an impulsive mode, indicating robust upward movement. The observed structure, orange wave 3, represents an expansion phase that follows the completion of orange wave 2.
Key observations:
-
Current Position and Structure:
-
The market is advancing within navy blue wave 5, signifying the final phase of a larger Elliott Wave cycle.
-
The active wave, orange wave 3, highlights strong bullish momentum, suggesting further upward movement in the short term.
-
-
Future Movements:
-
Upon completing orange wave 3, the market is expected to transition into a corrective orange wave 4, part of the lower-degree wave structure.
-
This marks the nearing completion of the larger wave cycle as navy blue wave 5 unfolds.
-
-
Risk Management:
-
An invalidation level is set at 41,652.82.
-
If the market price drops below this threshold, the current wave count will be invalid, necessitating a reassessment of the analysis.
-
Conclusion
The weekly Elliott Wave analysis of DJI projects a bullish trend continuation, with orange wave 3 actively progressing. The completion of orange wave 2 has set the stage for this strong upward phase, supported by the impulsive structure of navy blue wave 5.
Key takeaways:
-
Bullish Momentum Continues: The current trend is expected to persist until orange wave 3 concludes.
-
Transition Ahead: After the current wave phase, a corrective orange wave 4 is anticipated as part of the lower-degree sequence.
-
Validation Threshold: The bullish outlook holds as long as the price remains above 41,652.82.
This analysis highlights the ongoing bullish momentum while preparing for the eventual transition to a corrective phase as the larger wave structure approaches completion.
Technical analyst: Malik Awais.
DJI Elliott Wave technical analysis [Video]
Author

Peter Mathers
TradingLounge
Peter Mathers started actively trading in 1982. He began his career at Hoei and Shoin, a Japanese futures trading company.


