Dollar Index Price Analysis: DXY eyes bullish reversal on weekly chart
- DXY's weekly chart shows a falling wedge breakout.
- The index could rise to September highs above 94.50.

The dollar index, which tracks the greenback's value against majors, looks set to confirm a falling wedge breakout – a bullish reversal pattern – on the weekly chart.
The index has flipped the channel hurdle into support, currently at 90.00. A close above would confirm the breakout and open the doors for a rally to 94.72 (September high).
The daily chart also indicates the path of least resistance is to the higher side. The bullish outlook will be invalidated if the index finds acceptance under the former hurdle-turned-support of the inverse head-and-shoulders pattern breached to the higher side earlier this week.
Weekly chart
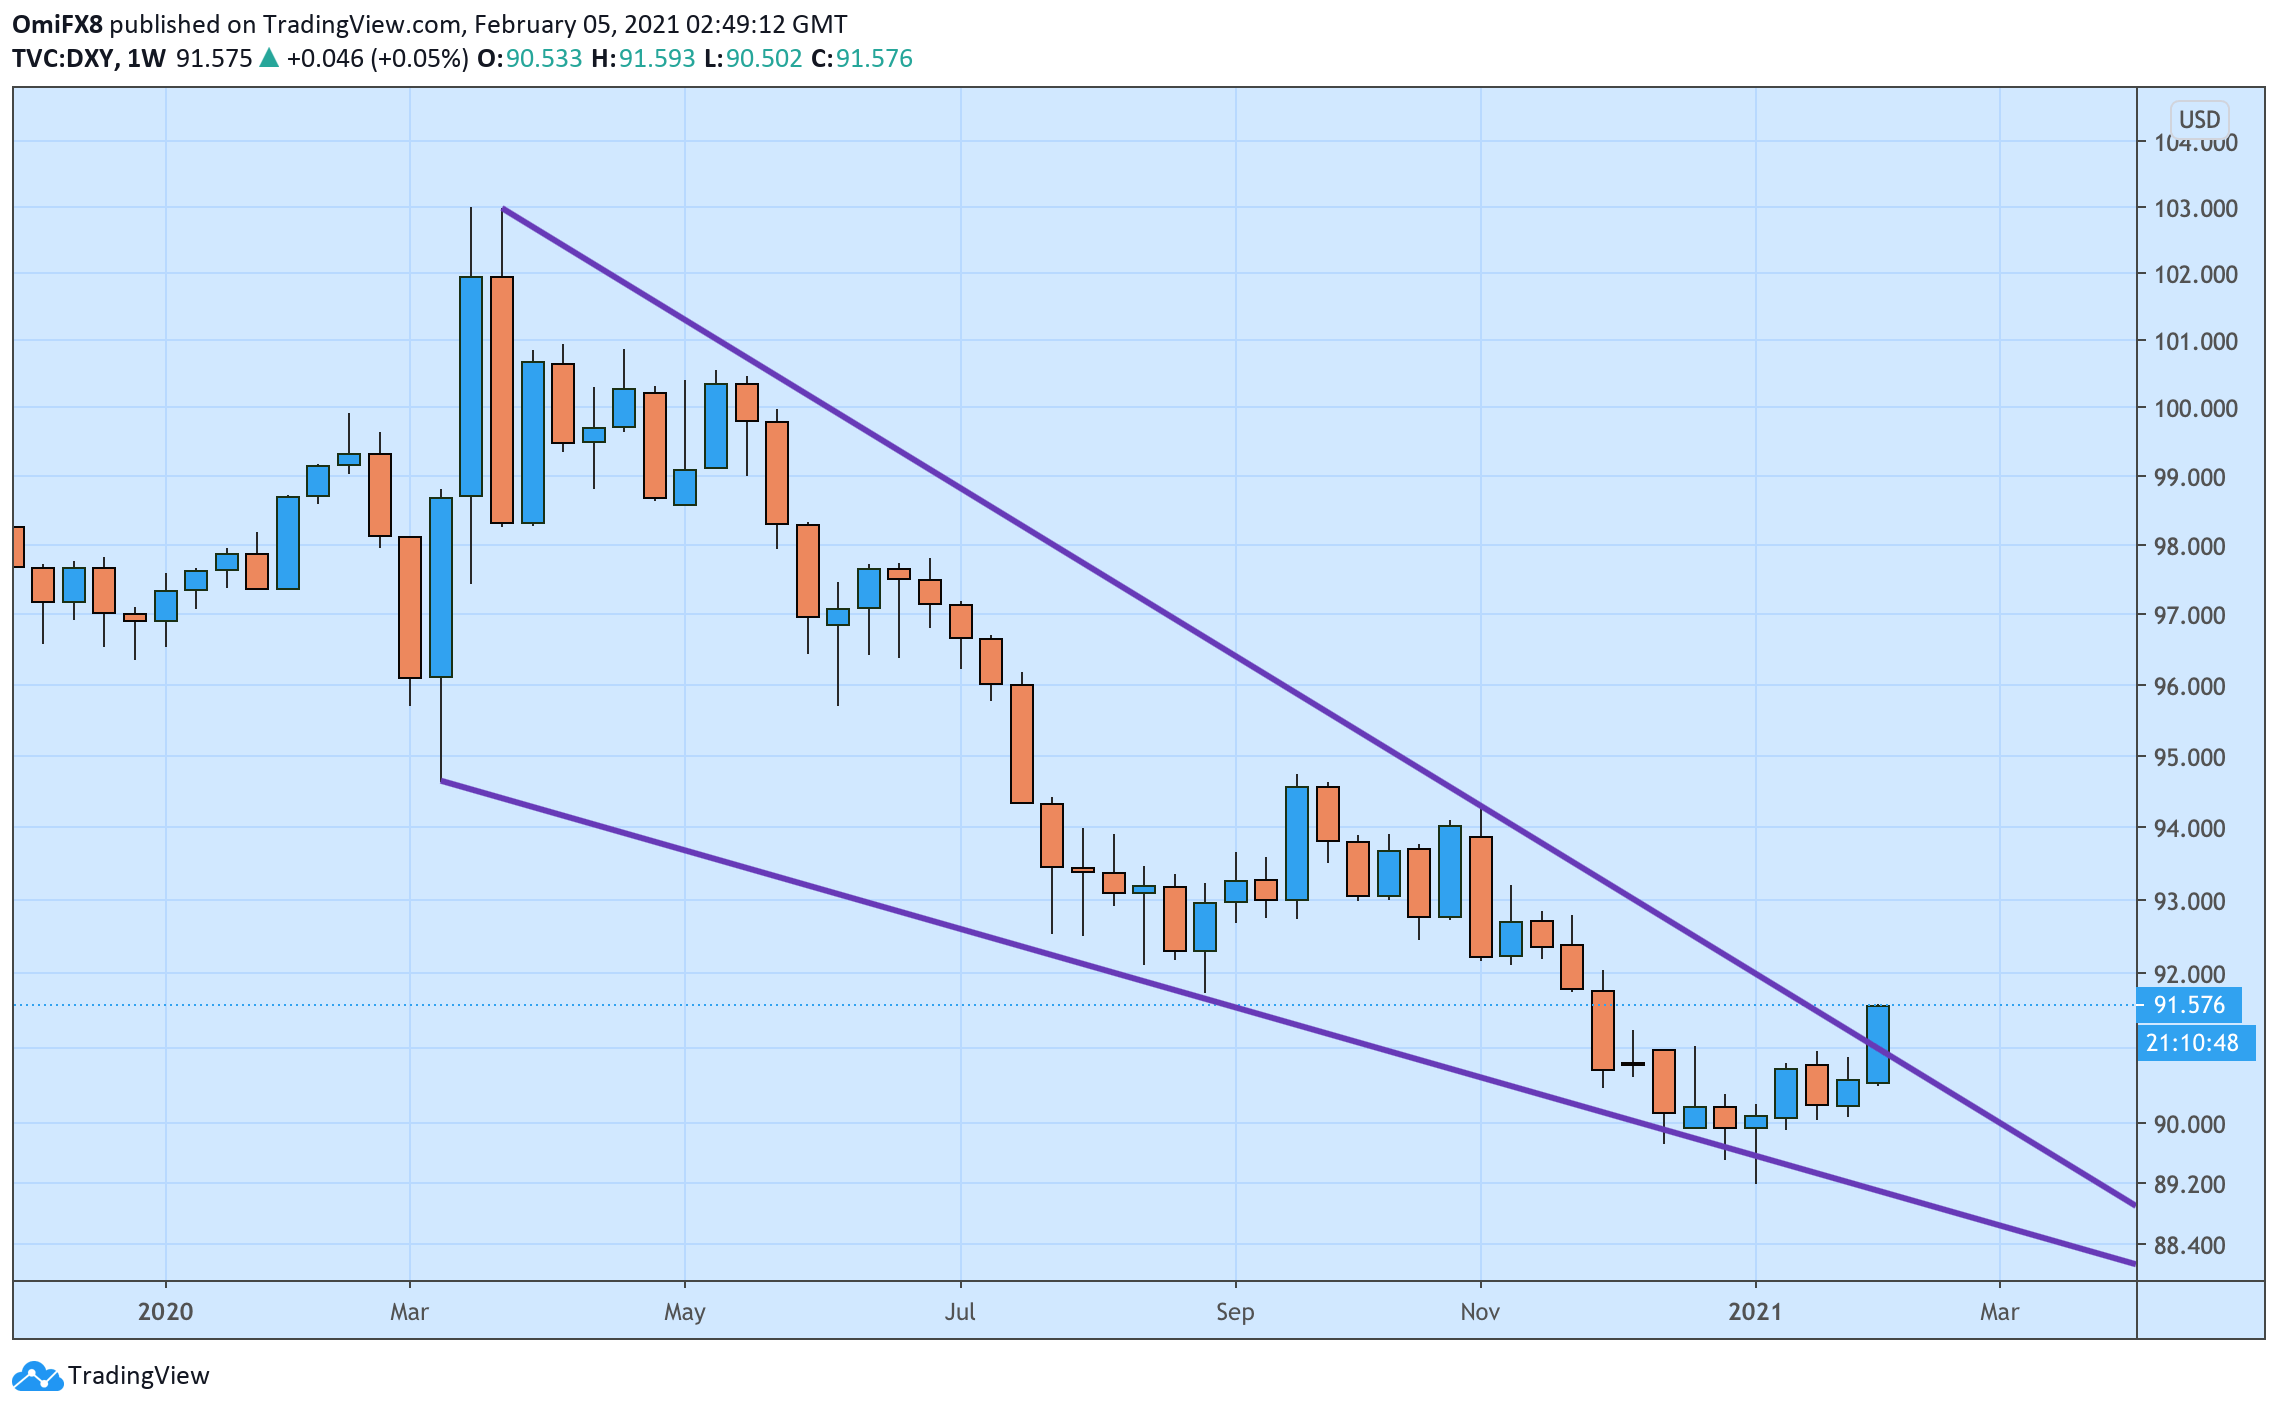
Trend: Bullish
Technical levels
Author

Omkar Godbole
FXStreet Contributor
Omkar Godbole, editor and analyst, joined FXStreet after four years as a research analyst at several Indian brokerage companies.


