CSX Corp. (CSX) Elliott Wave technical analysis [Video]
![CSX Corp. (CSX) Elliott Wave technical analysis [Video]](https://editorial.fxsstatic.com/images/i/stock-01.jpg)
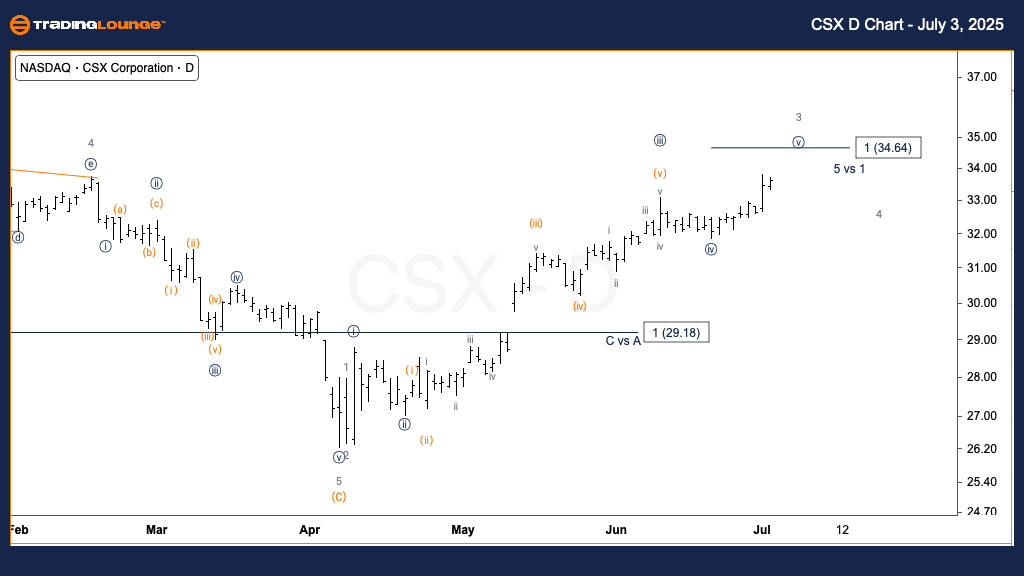
CSX Elliott Wave technical analysis – Daily chart
Function: Trend.
Mode: Impulsive.
Structure: Motive.
Position: Wave {v} of 3.
Direction: Upside in wave {v}.
Details: Expecting continuation higher into wave {v} of 3, with wave {i} equality near $35.
CSX Elliott Wave technical analysis – One-hour chart
Function: Trend.
Mode: Impulsive.
Structure: Motive.
Position: Wave (iv) of {v}.
Direction: Upside in wave (v).
Details: Anticipating one more upward leg in wave (v); potential extension likely as wave (iii) exceeded wave (i).

This analysis provides a technical overview of CSX Corp. (CSX) based on Elliott Wave Theory across two key timeframes.
CSX daily chart – Elliott Wave overview
On the daily chart, CSX continues its upward momentum through wave {v} of 3. This wave is progressing toward the $35 level, aligning with the size of wave {i}. The structure remains impulsive and suggests a strong bullish trend. Wave {v} usually completes the third wave in an Elliott Wave cycle, which is typically the most powerful segment, signaling potential further gains.
CSX one-hour chart – Elliott Wave breakdown
In the 1-hour chart, CSX is currently forming wave (iv) of {v}, likely setting up the final upward move in wave (v). Because wave (iii) extended beyond wave (i), wave (v) could also continue longer than average. This indicates a possibility of additional upside momentum following the short consolidation phase, possibly pushing the stock price past the $35 benchmark.
CSX Corp. (CSX) Elliott Wave technical analysis [Video]
Author

Peter Mathers
TradingLounge
Peter Mathers started actively trading in 1982. He began his career at Hoei and Shoin, a Japanese futures trading company.


