CSL Limited - CSL stock analysis and Elliott Wave technical forecast [Video]
![CSL Limited - CSL stock analysis and Elliott Wave technical forecast [Video]](https://editorial.fxstreet.com/images/Markets/Equities/Industries/EnergyStocks/electric-power-637435385712017394.jpg)
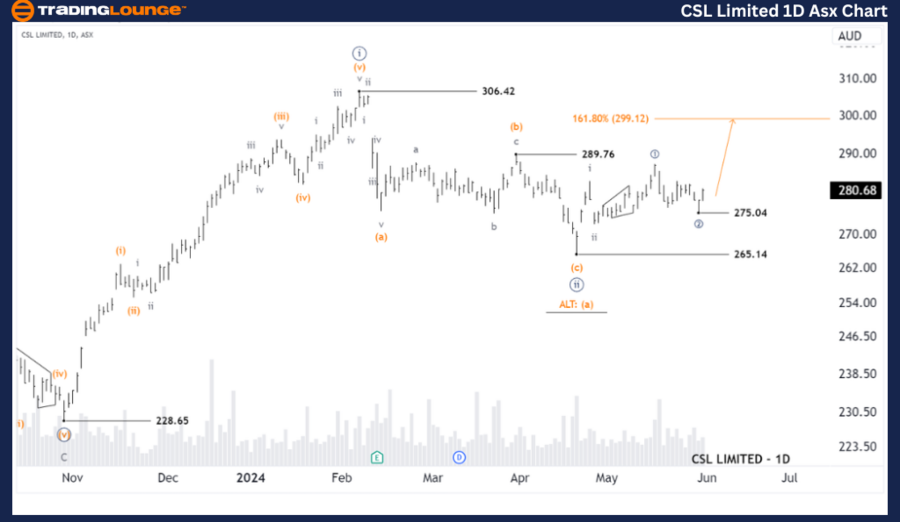
ASX: CSL LIMITED - CSL Elliott Elliott Wave Technical Analysis TradingLounge (1D Chart).
Greetings, Our Elliott Wave analysis today updates the Australian Stock Exchange (ASX) with CSL LIMITED - CSL. We've identified that wave ((ii))-navy has recently bottomed out, and wave ((iii))-navy is now unfolding to push significantly higher.
ASX: CSL Limited - CSL Elliott Wave technical analysis
ASX: CSL LIMITED - CSL 1D Chart (Semilog Scale) Analysis.
Function: Major trend (Minute degree, navy).
Mode: Motive.
Structure: Impulse.
Position: Wave ((3))-navy of Wave iii-grey of Wave ((iii))-navy.
Details: The short-term outlook indicates that wave ((ii))-navy has just completed, and wave ((iii))-navy is unfolding. It is subdividing into waves i, ii-grey and waves ((1)), ((2))-navy. Now, wave ((3))-navy can push higher, while the price must stay above 275.04, aiming for a target of 300.00.
Invalidation point: 275.04.
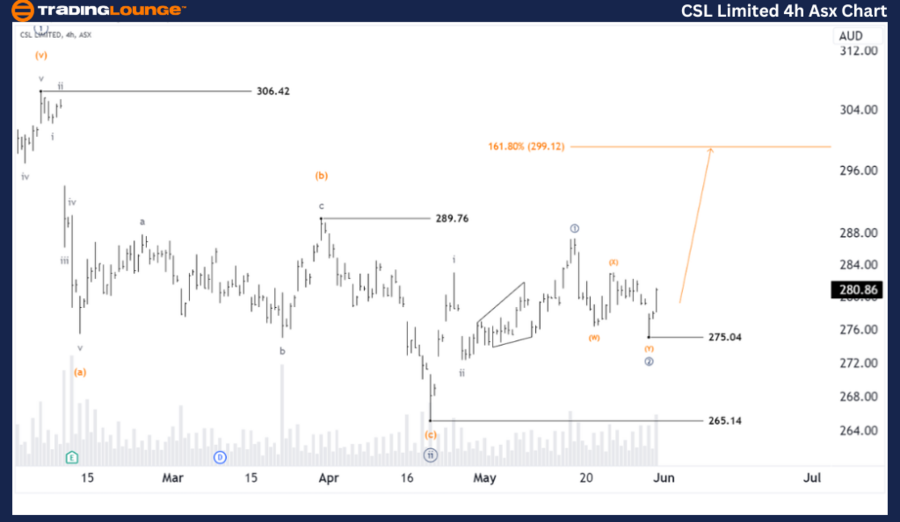
ASX: CSL LIMITED - CSL Elliott Wave Technical Analysis TradingLounge (4-Hour Chart).
ASX: CSL Limited - CSL Elliott Wave technical analysis
ASX: CSL LIMITED - CSL 4-Hour Chart Analysis.
Function: Major trend (Subminuette degree, grey).
Mode: Motive.
Structure: Impulse.
Position: Wave ((3))-navy of Wave iii-grey.
Details: The shorter-term outlook shows that wave ((2))-navy has bottomed with a Double Zigzag pattern. This suggests that wave ((3))-navy is unfolding to reach the 300.00 level. The price must stay above 275.04 to maintain this outlook.
Invalidation point: 275.04.
Conclusion
Our analysis, forecast of contextual trends, and short-term outlook for ASX: CSL LIMITED - CSL aim to provide readers with insights into the current market trends and how to capitalize on them effectively. We offer specific price points that act as validation or invalidation signals for our wave count, enhancing the confidence in our perspective. By combining these factors, we strive to offer readers the most objective and professional perspective on market trends.
Technical analyst: Hua (Shane) Cuong, CEWA-M (Master’s Designation).
ASX: CSL Limited - CSL Elliott Wave technical analysis [Video]
Author

Peter Mathers
TradingLounge
Peter Mathers started actively trading in 1982. He began his career at Hoei and Shoin, a Japanese futures trading company.


