CRWD: Simple coincidence reaction?

Recent price action in CRWD suggested the stock was entering a deeper corrective phase. If the prior move completed a Leading Diagonal, the market typically responded with a sharp retracement. This retracement often targeted the 0.618 level of the entire advance. As a result, we anticipated increased volatility during this phase. Moreover, corrective waves usually produced failed bounces and weaker momentum. Consequently, the market adopted a more defensive tone before resetting the structure.
However, once the correction completed, CRWD positioned itself for a stronger trend leg. A Leading Diagonal often preceded a powerful wave 3 advance. Therefore, the broader outlook remained constructive despite short-term weakness. In the near term, corrective pressure dominated the environment. After the pullback exhausted, the stock had the potential to resume a stronger bullish phase.
Elliott Wave outlook: CrowdStrike CRWD September 2025 weekly chart
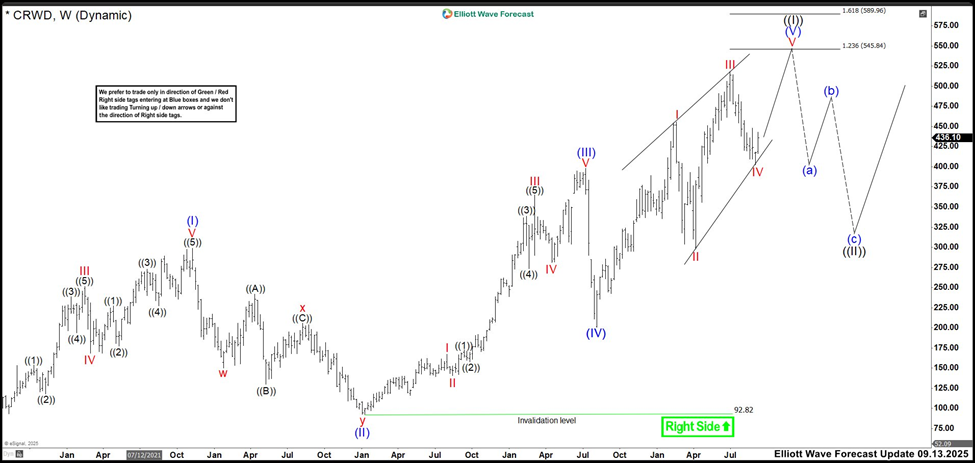
In the latest CRWD update, we tracked a leading diagonal structure built by impulsive price action. The pattern later evolved toward a potential ending diagonal. We clearly identified waves (I) and (II) early in the structure. The market then advanced strongly within wave (III). Wave (III) formed a clean five-wave impulse labeled I, II, III, IV, and V. However, wave (IV) retraced deeply and overlapped wave (I). This overlap invalidated the standard impulse structure. Consequently, the pattern transformed into a leading diagonal. Despite this change, price continued moving higher.
Furthermore, price broke above wave I and confirmed the extension scenario. Wave III ended near the 517 zone. After that, wave IV started its corrective phase. Since wave IV entered wave I’s territory again, the structure shifted. We then expected an ending diagonal to complete wave (V) of ((I)). For confirmation, price needed to rise toward the 545.84–589.96 resistance zone. A strong bearish reaction was likely in that area. If price reacted sharply, it likely marked cycle completion. This reaction also suggested that a broader correction had begun.
Elliott Wave principle behind the market structure
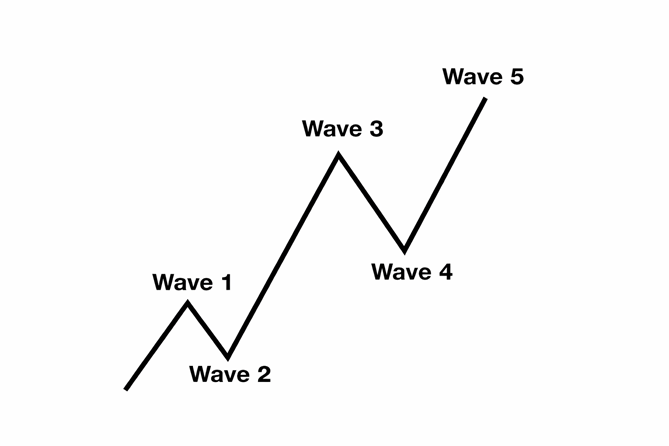
Impulse
An impulse is a clean 5‑wave pattern that drives the trend forward.
- Waves 1‑3‑5 are strong and directional.
- No overlap between waves 1 and 4.
- Wave 3 is usually the strongest.
Structure is clear, with increasing momentum.
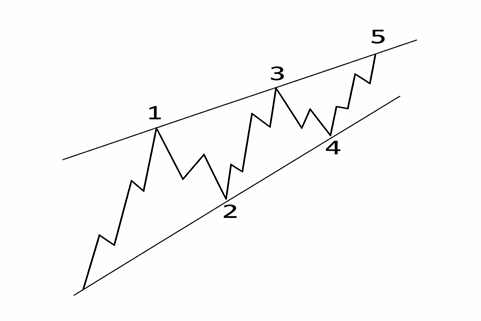
Leading Diagonal
A Leading Diagonal appears at the start of a new trend and moves more slowly and contractively.
- Waves 1 and 4 can overlap.
- Impulsive waves often look like zigzags.
- Each leg loses momentum.
Forms a wedge that usually leads to a deep correction.
In summary:
- Impulse = established trend, clean and strong movement.
- Leading Diagonal = early trend, choppy and corrective structure
Elliott Wave outlook: CrowdStrike CRWD March 2026 weekly chart
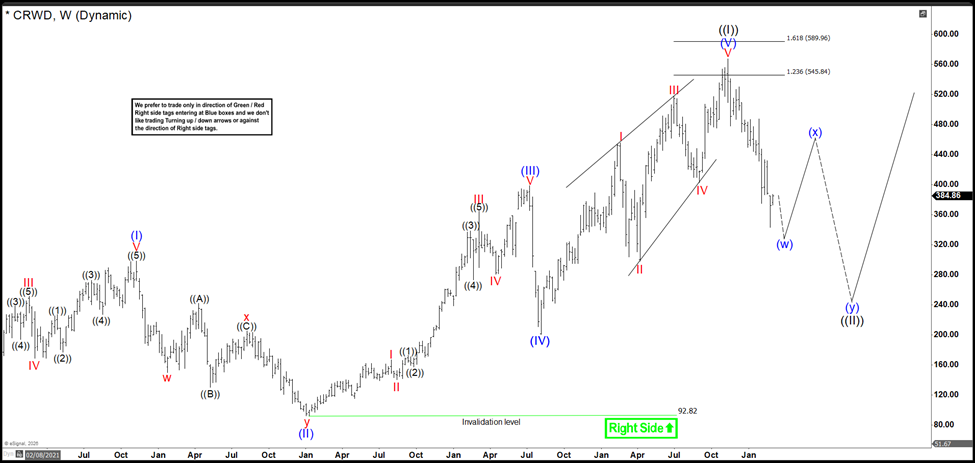
As expected, the market reached the projected zone and reacted sharply to the downside. Price completed the ending diagonal as wave (V). In addition, it finalized the larger leading diagonal as wave ((I)). Immediately after, the correction began. This move confirmed that our structure was correct. It also respected the projected Elliott Wave levels.
Now, we simply need to wait for the next buying opportunity. CRWD started correcting a Grand Super Cycle structure. Therefore, the pullback could become deep and extended. The typical target area sits near 216. However, price could drop below 200 before stabilizing. This zone may offer a strong long-term buying opportunity. From there, price could eventually advance toward 1000. For now, we will let the market develop further. After one quarter, we will reassess the structure and evaluate new buy signals.
Author

Elliott Wave Forecast Team
ElliottWave-Forecast.com


