|

Crude Oil slumps despite surprise drawdown in US barrel counts, WTI back into $72

  • WTI declined on Thursday, extending losses as broad-market risk flows reverse direction.
  • Crude Oil markets are facing declines, shrugging off an unexpected decline in US crude stocks.
  • Rough year-end markets are pulling down barrel prices to close out 2023.

West Texas Intermediate (WTI) US Crude Oil extended a decline on Thursday, backsliding into the low end and testing below the $72 handle as market risk appetite sours following a surprise jump in US Treasury yields, and shrugging off a surprise decline in US crude stocks.

According to figures from the Energy Information Administration (EIA), US barrel counts declined an unexpected -6.9 million barrels for the week ended December 22, far below the forecast 2.7 million decline and eating away at the previous week’s 2.9 million barrel buildup.

Red Sea tensions have begun to recede as logistics return to the region. Tensions mounted after Iran-backed Houthi rebels in Yemen began attacking logistics ships passing through the Red Sea, but a coalition naval force has descended on the region to allow ships to resume passing through the critical supply line between Europe and Asia.

2023’s production clampdown by the Organization of the Petroleum Exporting Countries (OPEC) failed to spark a long-term bull run in Crude Oil bids, as several smaller member states snub the oil cartel’s voluntary production caps, sparking the departure of Angola from the oil organization’s ranks. Despite key member states dedicated to ongoing production cuts, most notably Saudi Arabia extending over a million barrels per day in pumping reductions, Crude Oil production continues to outpace global oil demand.

WTI Technical Levels

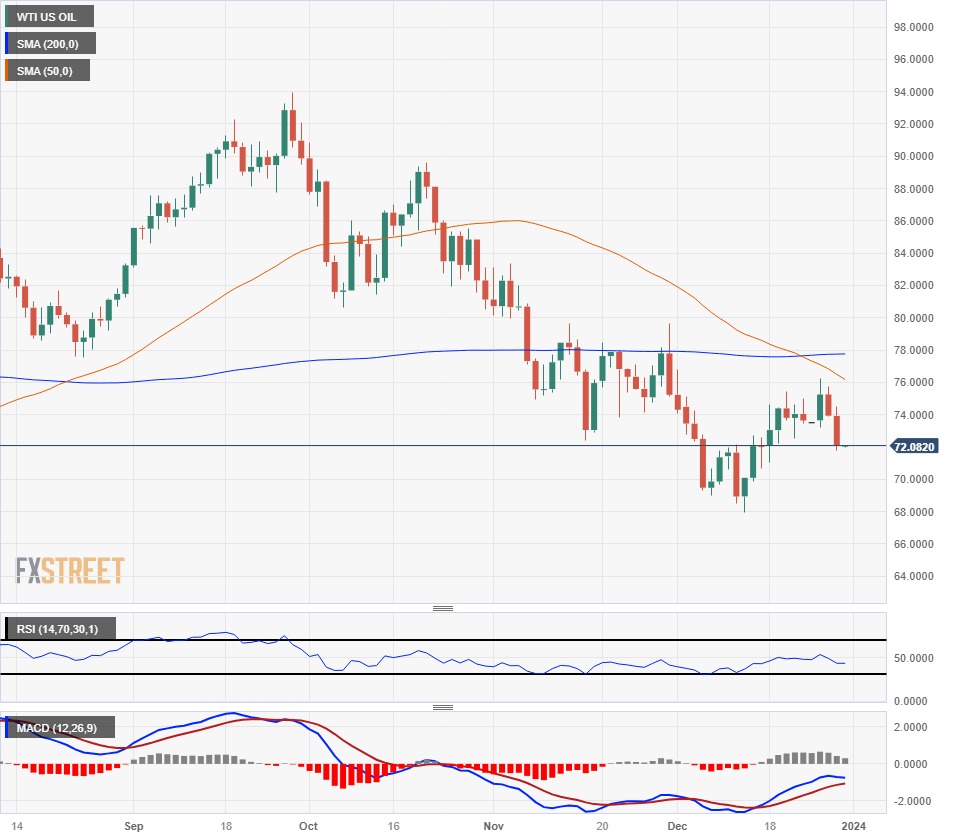
Intraday US Crude Oil action has dragged WTI down through the 200-day Simple Moving Average (SMA) near $73.75, descending to re-test chart territory below the $72 handle.

WTI has declined nearly 6% from the week’s high near $76.20, marking in a lower high on the daily candlesticks and pricing in a new technical ceiling while the 50-day SMA accelerates into the low side of the 200-day SMA after confirming a bearish cross.

WTI Daily Chart

WTI Technical Levels

WTI US OIL

Overview
Today last price72.05
Today Daily Change-1.89
Today Daily Change %-2.56
Today daily open73.94
 
Trends
Daily SMA2072.63
Daily SMA5076.83
Daily SMA10080.98
Daily SMA20077.74
 
Levels
Previous Daily High75.71
Previous Daily Low73.91
Previous Weekly High75.41
Previous Weekly Low71.01
Previous Monthly High83.34
Previous Monthly Low72.39
Daily Fibonacci 38.2%74.6
Daily Fibonacci 61.8%75.03
Daily Pivot Point S173.33
Daily Pivot Point S272.72
Daily Pivot Point S371.53
Daily Pivot Point R175.13
Daily Pivot Point R276.32
Daily Pivot Point R376.93

Author

Joshua Gibson

Joshua joins the FXStreet team as an Economics and Finance double major from Vancouver Island University with twelve years' experience as an independent trader focusing on technical analysis.

More from Joshua Gibson
Share:

Markets move fast. We move first.

Orange Juice Newsletter brings you expert driven insights - not headlines. Every day on your inbox.

By subscribing you agree to our Terms and conditions.

Editor's Picks

EUR/USD softens below 1.1750 after Fed Minutes

The EUR/USD pair attracts some sellers near 1.1745 during the early Asian session on Wednesday. The US Dollar edges higher against the Euro after the release of minutes from the Federal Reserve's December meeting. The US Initial Jobless Claims report will be released later in the day. Trading volumes are expected to remain thin ahead of the New Year holidays.

GBP/USD trades flat above 1.3450 amid thin trading volume

The GBP/USD pair holds steady around 1.3465 during the early Asian trading hours on Wednesday. However, the Bank of England guided that monetary policy will remain on a gradual downward path, which might underpin the Cable against the US Dollar. Financial markets are expected to trade on thin volumes as traders prepare for the New Year holiday.

Gold stable above $4,350 as the year comes to an end

Gold price got to recover some modest ground on Tuesday, holding on to intraday gains and changing hands at $4,360 a troy ounce in the American afternoon. The bright metal showed no reaction to the release of the FOMC December meeting minutes.

Ethereum: ETH holds above $2,900 despite rising selling activity

Ethereum (ETH) held the $2,900 level despite seeing increased selling pressure over the past week. The Exchange Netflow metric showed deposits outweighed withdrawals by about 400K ETH. The high value suggests rising selling activity amid the holiday season.

Economic outlook 2026-2027 in advanced countries: Solidity test

After a year marked by global economic resilience and ending on a note of optimism, 2026 looks promising and could be a year of solid economic performance. In our baseline scenario, we expect most of the supportive factors at work in 2025 to continue to play a role in 2026.

Crypto market outlook for 2026

Year 2025 was volatile, as crypto often is.  Among positive catalysts were favourable regulatory changes in the U.S., rise of Digital Asset Treasuries (DAT), adoption of AI and tokenization of Real-World-Assets (RWA).