Crude Oil recedes post-Fed, WTI tumbles below $80
- WTI slips back below $80 per barrel.
- Crude Oil markets unsettled by latest Fed rate call.
- Supplies continue to overwhelm Crude Oil demand.

West Texas Intermediate (WTI) US Crude Oil fell below $80.00 per barrel on Wednesday as US Crude Oil supply continues to overwhelm demand, and the US Federal Reserve (Fed) remains hobbled on the path forward toward rate cuts.
With most global markets focused on the Fed’s latest rate call, the Energy Information Administration (EIA) printed its latest week-on-week barrel counts for US Crude Oil supply. According to the EIA, US barrel counts grew by 7.265 million for the week ended April 26, well below the forecast -2.3 million decline, and entirely engulfing the -6.368 million decline reported the week before.
The EIA’s upside barrel buildup adds to the same scenario unfolding in American Petroleum Institute (API) numbers published earlier this week. This week’s EIA print represents the highest WoW Crude Oil buildup since the week ended February 9. EIA US Crude Oil Stocks are up 9.473 million barrels in the month of April, and US Crude Oil production tracked by the EIA has oversupplied nearly 30 million barrels since the beginning of the year.
The Fed’s latest rate call held interest rates steady as markets broadly expected, but bumpy progress on dragging inflation lower has hobbled the Fed’s ability to reduce interest rates, and markets will be pivoting to focus on Friday’s US Nonfarm Payrolls (NFP) labor report for a hard look at developments in the domestic US economy.
WTI technical outlook
Wednesday’s decline drag WTI back below $80.00 per barrel and dropping out of a firm demand zone between $82.00 and $80.00. WTI is not trading into the 200-day Exponential Moving Average (EMA) near $79.17, and US Crude Oil is now trading down nearly 10% from the last swing high of $81.25 in early April.
WTI hourly chart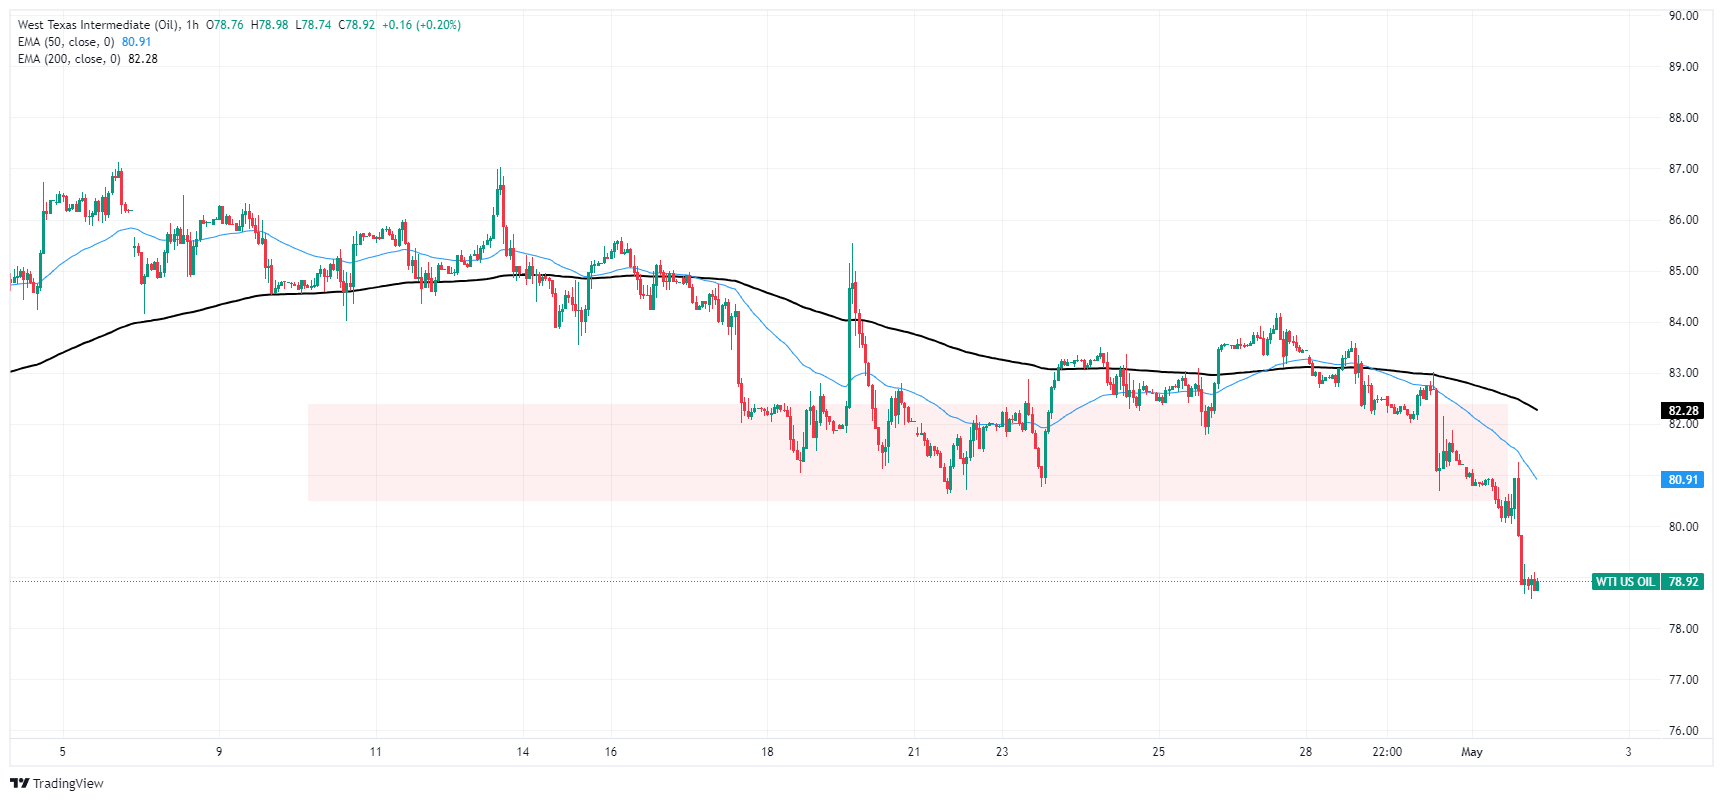
WTI daily chart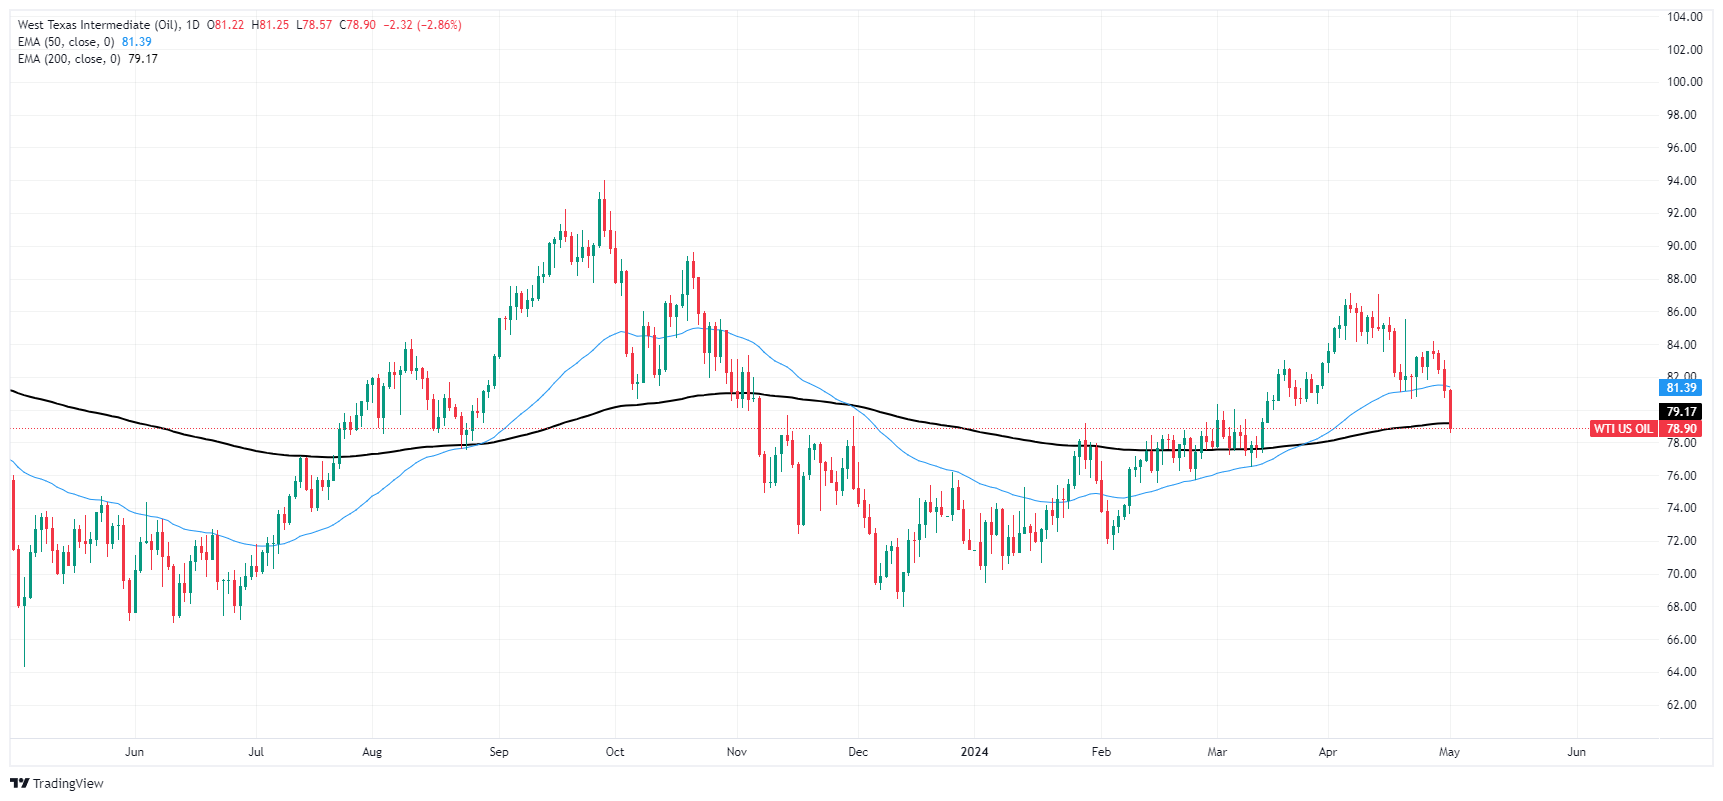
Author

Joshua Gibson
FXStreet
Joshua joins the FXStreet team as an Economics and Finance double major from Vancouver Island University with twelve years' experience as an independent trader focusing on technical analysis.


