|

Crude Oil Price News and Forecast: WTI vulnerable below $60 a barrel

WTI Oil Outlook: bear take a breather after 4.5% fall; outlook remains negative

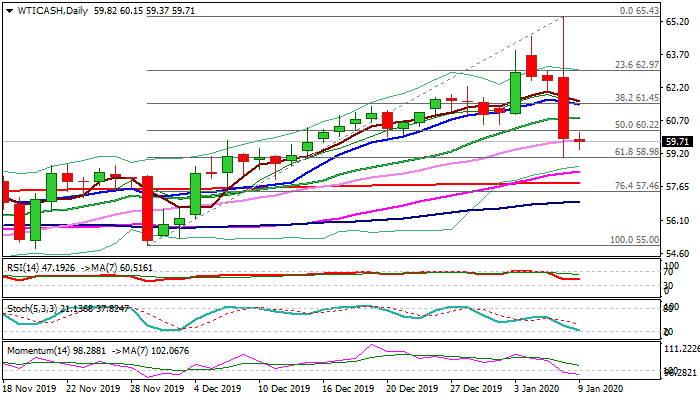
WTI oil price is holding within narrow consolidation on Thursday, following 4.5% fall on Wednesday on comments from President Trump who said the US refrains from further military action. The sentiment was additionally weakened by unexpected rise in US crude stocks, helping fresh bears to register the biggest one day loss since 29 Nov. Wednesday's large bearish candle with long upper shadow weighs on near-term action and signaling further weakness, as daily momentum broke into negative territory and continues to head south. Read more...

WTI

Oil Price Analysis: WTI vulnerable below $60 a barrel

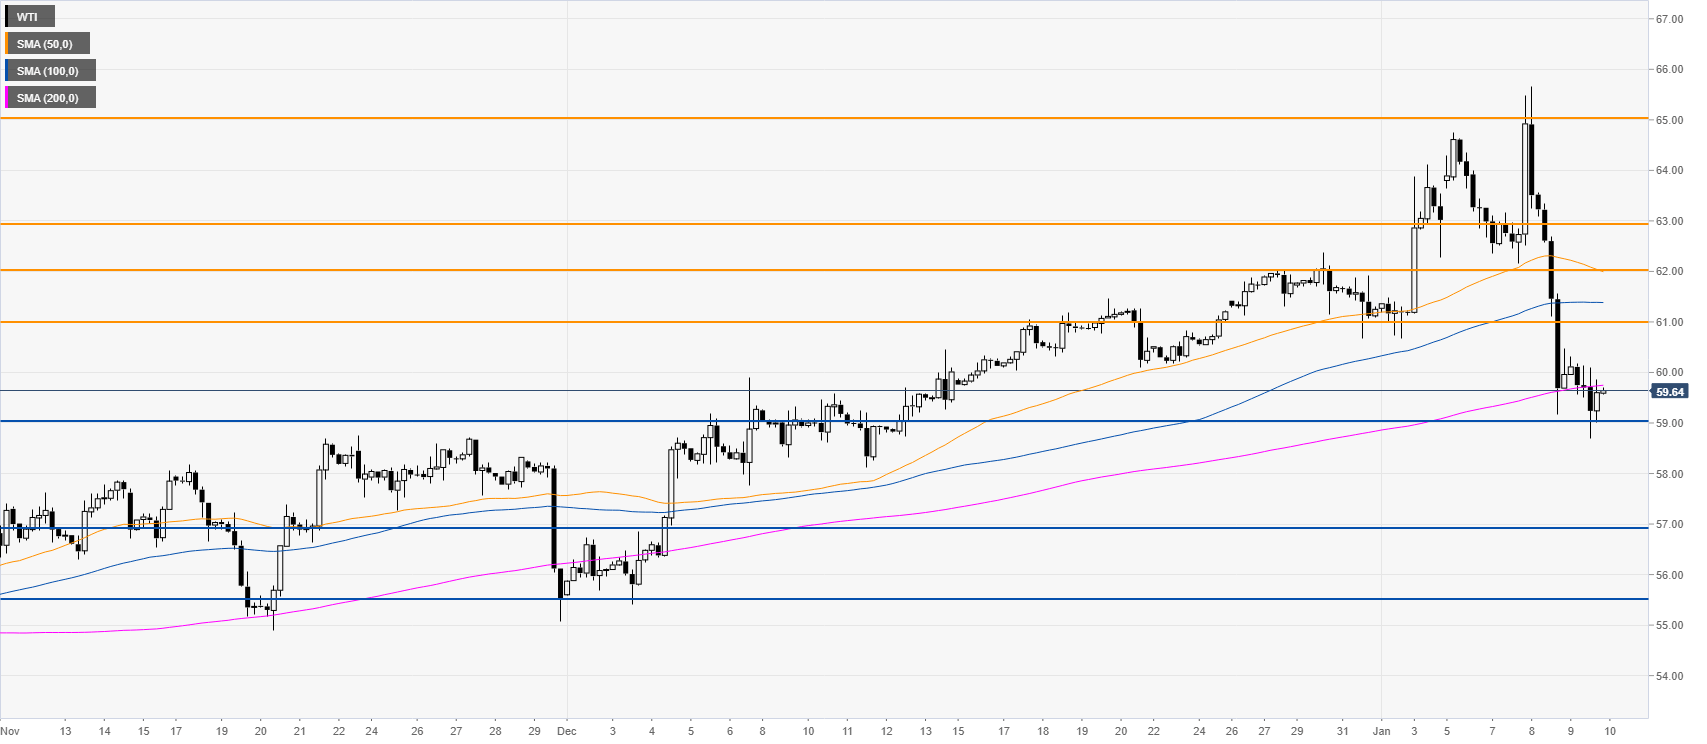
The crude oil West Texas Intermediate (WTI) rejected the 65 handle while maintaining above the main SMAs. Thursday was a consolidation day and is about to end within Wednesday’s range.  

Crude oil four-hour chart

Black gold is consolidating the sharp selloff to $59 a barrel and the 200 SMA on the four-hour chart. As the bears are keeping the pressure on, the market is more likely to continue to drift lower towards 57 and 55.50 price levels. However, a consolidation in the 61/59 range is not to be ruled out. Resistances are seen near 61, 62 and 63 handles. Read more...

WTI OIL daily chart

WTI looks to settle below $60 as selloff on easing geopolitical tensions continues

Crude oil prices continued to push lower after suffering heavy losses on Wednesday as easing worries over a protracted US-Iran conflict and its potential negative impact on oil supply caused investors to book their profits following the sharp rally witnessed during the first half of the week.

The barrel of West Texas Intermediate (WTI), which touched its highest level since April at $65.60 on Wednesday, closed with a daily loss of more than 4% and was last seen trading at $59.55, erasing 0.7% on a daily basis. Read more...

WTI

Overview
Today last price59.65
Today Daily Change-0.36
Today Daily Change %-0.60
Today daily open60.01
 
Trends
Daily SMA2060.93
Daily SMA5058.64
Daily SMA10057.04
Daily SMA20057.9
 
Levels
Previous Daily High65.67
Previous Daily Low59.17
Previous Weekly High64.11
Previous Weekly Low60.67
Previous Monthly High62.38
Previous Monthly Low55.41
Daily Fibonacci 38.2%61.65
Daily Fibonacci 61.8%63.19
Daily Pivot Point S157.56
Daily Pivot Point S255.12
Daily Pivot Point S351.06
Daily Pivot Point R164.06
Daily Pivot Point R268.12
Daily Pivot Point R370.56

Author

More from FXStreet Team
Share:

Editor's Picks

EUR/USD eyes nine-day EMA barrier after rebounding from 1.1600

EUR/USD gains ground after registering modest losses in the previous session, trading around 1.1620 during the Asian hours on Friday. The technical analysis of the daily chart suggests an ongoing bearish bias as the pair remains within the descending channel pattern.

GBP/USD: Pound Sterling ticks up against US Dollar in countdown to US NFP

The Pound Sterling trades marginally higher to near 1.3365 against the US Dollar during the Asian trading session on Friday. The GBP/USD pair edges up as the US Dollar ticks down ahead of the United States Nonfarm Payrolls data for February, which will be published at 13:30 GMT.

Gold rises but remains on track for weekly loss in five weeks

Gold price recovers its recent losses from the previous session on Friday. The yellow metal advances as the broader precious metals market rebounds on safe-haven demand. However, the yellow metal is on track for its first weekly decline in five weeks as escalating Middle East tensions push oil prices higher, fueling inflation concerns and reducing bets on Federal Reserve rate cuts.

Bitcoin, Ethereum and Ripple at risk as US-Iran war extends

Bitcoin, Ethereum, and Ripple trade cautiously at press time on Friday, close to key support levels after a roughly 2% pullback the previous day. Bitcoin holds above $71,000, Ethereum at $2,000, and XRP continues to consolidate in a sideways range.

The market compass is pointing at a barrel of Oil

The Asian open is arriving with equities leaning the wrong way, and the reason is not complicated. The market’s compass needle has snapped firmly toward crude. In this tape, oil is not just another input price; it is the gravitational center around which every asset class is orbiting.

Ripple tests recovery strength amid steady ETF inflows, growing retail interest

Ripple (XRP) continues to demonstrate notable resilience as the cryptocurrency market navigates the persistent war in the Middle East after the United States (US) and Israel attacked Iran on Saturday.