Crude Oil goes nowhere with trading volumes already at lower levels
- Oil prices are slipping lower by less than 0.50%, reversing after a positive Asian session earlier.
- Markets are roughly range trading in search of levels while final US data makes its way.
- The US Dollar Index has a fresh two-year high in reach after upbeat Durable Goods revisions.

Crude Oil prices are stuck in red numbers on Monday with WTI hovering around $69, after Asian tailwinds quickly fading going into US trading session on Monday. Demand for Oil looks to be stalling again, according to recent Vortexa data published by Bloomberg, that reveals that floating Crude volumes are increasing by 7% against last week in again slower demand.
The US Dollar Index (DXY) – which measures the performance of the US Dollar (USD) against a basket of currencies – is has rallied after the preliminary November release of the US Durable Goods. Although the actual numbers were rather negative, the upward revision on the previous headline number from 0.3% to 0.8% was the main driver for the US Dollar appreciation. Traders will want to keep any positioning short as movements could be short-lived and face some quick profit-taking ahead of the Christmas holiday.
At the time of writing, Crude Oil (WTI) trades at $69.25 and Brent Crude at $72.41
Oil news and market movers: Bulgaria is buying Russian Oil, trading away from India
- The amount of Crude Oil held on tankers that have been stationary for at least seven days rose to 70.20 million barrels as of December 20, Vortexa data show, Bloomberg reports. That is a 7% increase against last week.
- Recent EU sanctions on Russian Oil vessels are being circumvented via Bulgaria, Romania and Turkey, Zerohedge published in a special report on Monday.
- President-elect Donald Trump lashed out at Panama during a rally over the weekend that the country charges exorbitant fees for passing via its key waterway, Bloomberg reports.
- With the Christmas holidays, the weekly Energy Information Administration release for the US Crude stockpile change numbers is due Thursday at 16:00 GMT.
- Indian Oil refiners are having diffculties to get their hands on cheaper Russian crude , according to people familiar with the matter, Reuters reports.
Oil Technical Analysis: Watch out for any squeezes
Crude Oil prices could see a small uptick, supported by some broad risk on tailwinds in the markets. Experienced traders will know that as of Monday and going into January, the rule of thumb is to have smaller positions on and take profit possibly even before the end of the same trading day. This means that any rally that might unfold in Oil in the coming days needs to be taken with caution as it might be very short-lived.
Looking up, the 100-day Simple Moving Average (SMA) at $70.79 and $71.46 (February 5 low) act as firm resistance levels nearby. Should more tailwinds emerge in support for Oil, the next pivotal level will be $75.27 (January 12 high). However, watch out for quick profit-taking as the year-end quickly approaches.
On the downside, $67.12 – a level that held the price in May and June 2023 and during the last quarter of 2024 – is still the first solid support nearby. In case that breaks, the 2024 year-to-date low emerges at $64.75, followed by $64.38, the low from 2023.
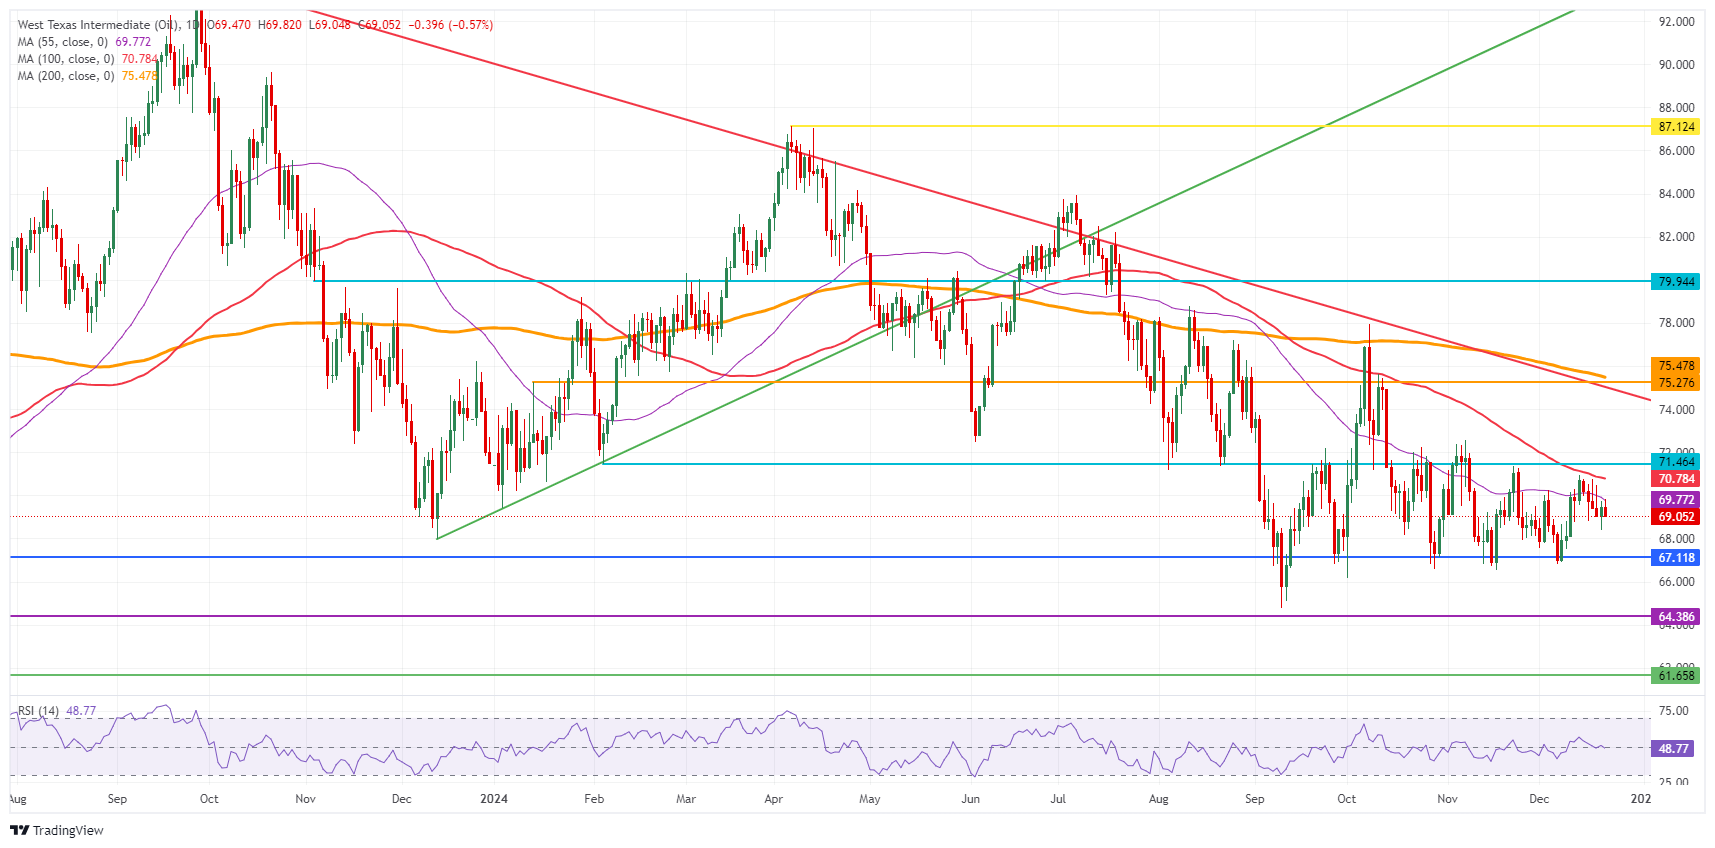
US WTI Crude Oil: Daily Chart
WTI Oil FAQs
WTI Oil is a type of Crude Oil sold on international markets. The WTI stands for West Texas Intermediate, one of three major types including Brent and Dubai Crude. WTI is also referred to as “light” and “sweet” because of its relatively low gravity and sulfur content respectively. It is considered a high quality Oil that is easily refined. It is sourced in the United States and distributed via the Cushing hub, which is considered “The Pipeline Crossroads of the World”. It is a benchmark for the Oil market and WTI price is frequently quoted in the media.
Like all assets, supply and demand are the key drivers of WTI Oil price. As such, global growth can be a driver of increased demand and vice versa for weak global growth. Political instability, wars, and sanctions can disrupt supply and impact prices. The decisions of OPEC, a group of major Oil-producing countries, is another key driver of price. The value of the US Dollar influences the price of WTI Crude Oil, since Oil is predominantly traded in US Dollars, thus a weaker US Dollar can make Oil more affordable and vice versa.
The weekly Oil inventory reports published by the American Petroleum Institute (API) and the Energy Information Agency (EIA) impact the price of WTI Oil. Changes in inventories reflect fluctuating supply and demand. If the data shows a drop in inventories it can indicate increased demand, pushing up Oil price. Higher inventories can reflect increased supply, pushing down prices. API’s report is published every Tuesday and EIA’s the day after. Their results are usually similar, falling within 1% of each other 75% of the time. The EIA data is considered more reliable, since it is a government agency.
OPEC (Organization of the Petroleum Exporting Countries) is a group of 12 Oil-producing nations who collectively decide production quotas for member countries at twice-yearly meetings. Their decisions often impact WTI Oil prices. When OPEC decides to lower quotas, it can tighten supply, pushing up Oil prices. When OPEC increases production, it has the opposite effect. OPEC+ refers to an expanded group that includes ten extra non-OPEC members, the most notable of which is Russia.
Author

Filip Lagaart
FXStreet
Filip Lagaart is a former sales/trader with over 15 years of financial markets expertise under its belt.


