Crude Oil extends declines on Chinese demand concerns, WTI falls below $80
- WTI tumbled below $80.00 per barrel as Crude Oil bids crumble.
- Crude Oil markets are extending a downside slide as Chinese demand slumps.
- WTI bull run sputters, bids within touch range of long-term averages.

West Texas Intermediate (WTI) Crude Oil fell on Tuesday as barrel traders grow fearful at the prospect of a slowdown in Chinese demand for fossil fuels. A decline in American Petroleum Institute (API) week-on-week barrel counts helped to bolster WTI prices into a weak recovery in late Tuesday trading, but an equivalent buildup of distillate products limited bullish potential.
China recently posted a slowdown in growth figures for the second quarter, hobbling broad-market expectations of a surge in Chinese demand for fossil fuels. After spending most of 2024 waiting for an uptick in Chinese Crude Oil demand, barrel traders have flipped to concerns that limited Chinese growth won’t provide enough barrel demand to eat up overhang in global markets.
The API reported yet another contraction in overall Crude Oil supply, showing a -4.44 million barrel contraction in privately counted supplies for the week ended June 12. Despite the extended decline in barrel counts, fully-refined gasoline stocks rose 365K barrels, with an additional buildup of partially-refined distillate inventories of 4.92 million barrels as end-chain refiners struggle to keep up with the availability of Crude Oil products.
WTI technical outlook
Tuesday’s bearish break has dragged WTI further below the 200-hour Exponential Moving Average (EMA) at $81.30 as downside momentum accelerates. WTI has extended a backslide from a recent upswing that fell just short of the $84.00 handle, and US Crude Oil prices have backslid over -5.5% peak-to-trough in July.
After a failed bull run through the top end of a consolidation pattern on daily candlesticks, A low break has dragged WTI bids into touch range of the 200-day EMA at $79.07 after shedding the $80.00 key handle on Tuesday.
WTI hourly chart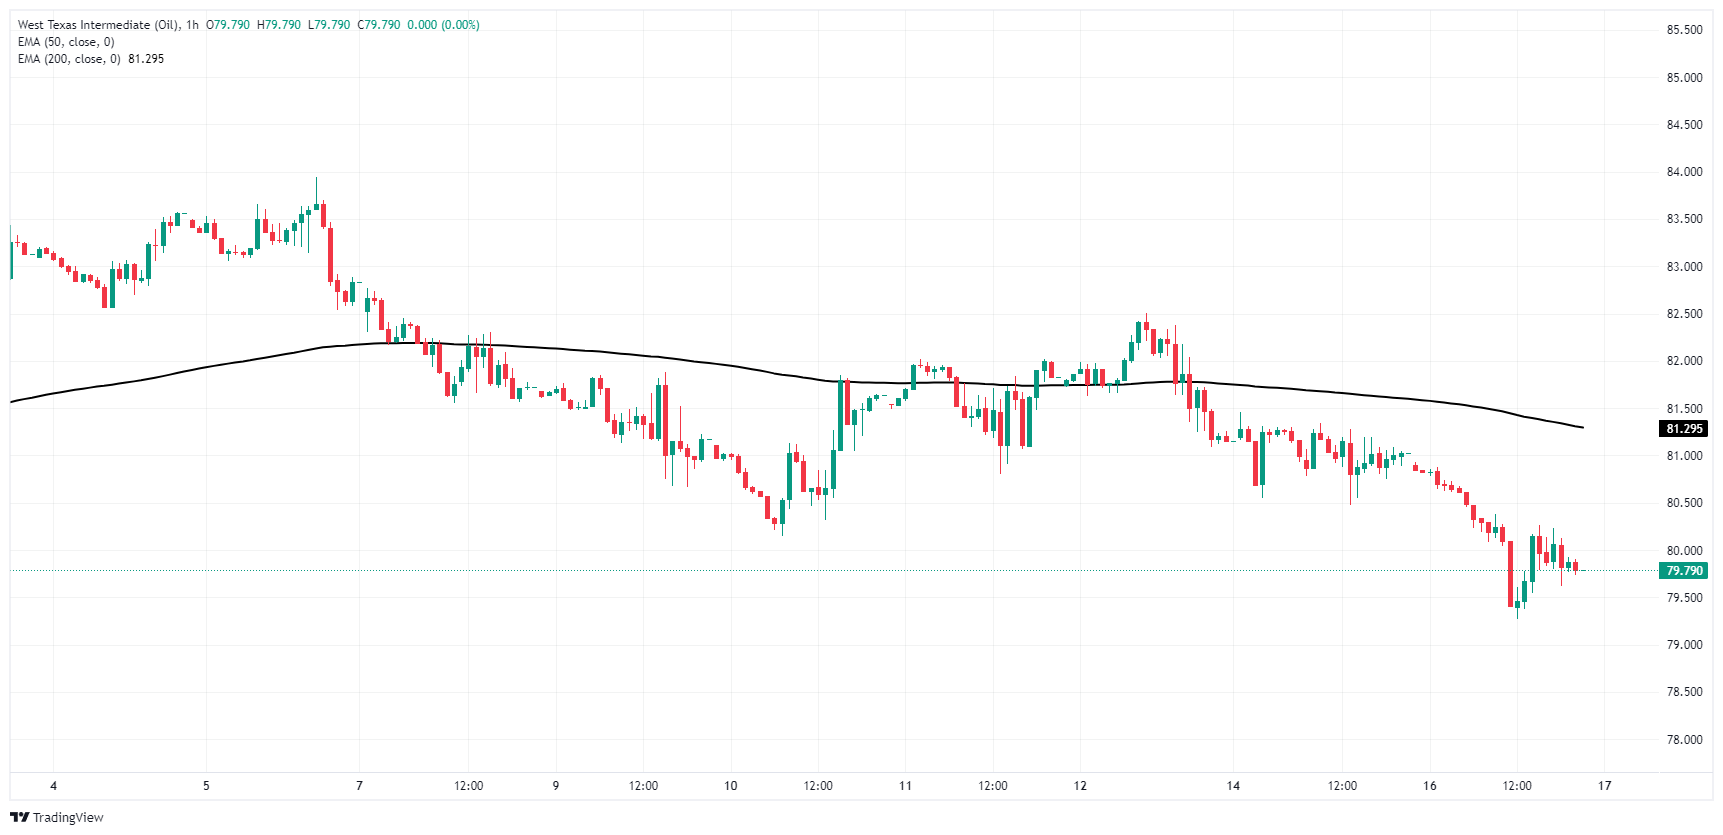
WTI daily chart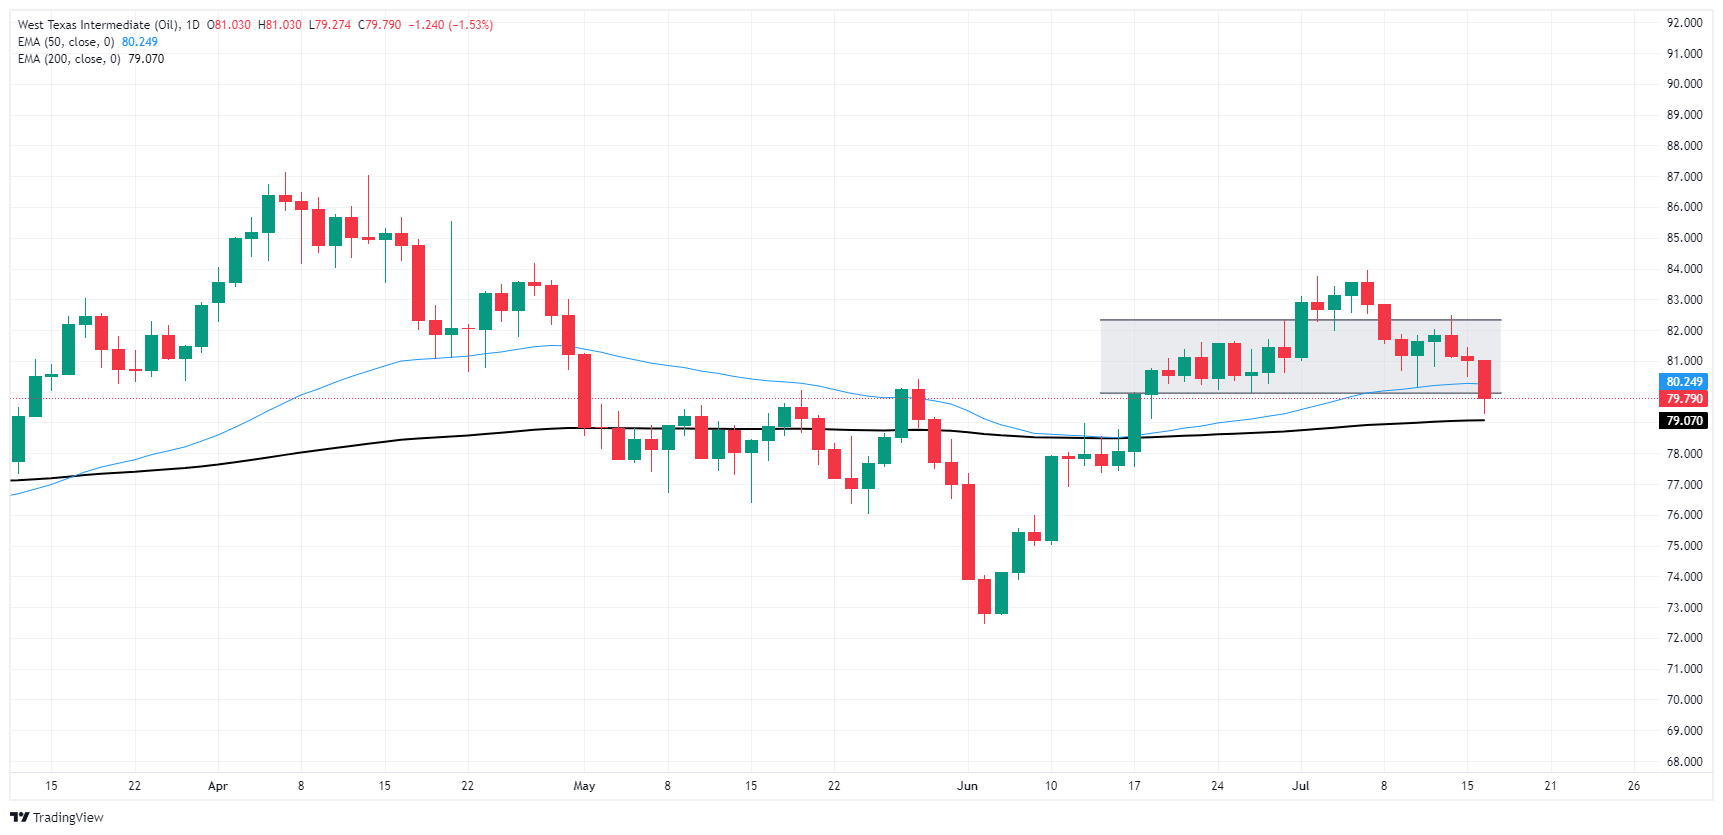
WTI Oil FAQs
WTI Oil is a type of Crude Oil sold on international markets. The WTI stands for West Texas Intermediate, one of three major types including Brent and Dubai Crude. WTI is also referred to as “light” and “sweet” because of its relatively low gravity and sulfur content respectively. It is considered a high quality Oil that is easily refined. It is sourced in the United States and distributed via the Cushing hub, which is considered “The Pipeline Crossroads of the World”. It is a benchmark for the Oil market and WTI price is frequently quoted in the media.
Like all assets, supply and demand are the key drivers of WTI Oil price. As such, global growth can be a driver of increased demand and vice versa for weak global growth. Political instability, wars, and sanctions can disrupt supply and impact prices. The decisions of OPEC, a group of major Oil-producing countries, is another key driver of price. The value of the US Dollar influences the price of WTI Crude Oil, since Oil is predominantly traded in US Dollars, thus a weaker US Dollar can make Oil more affordable and vice versa.
The weekly Oil inventory reports published by the American Petroleum Institute (API) and the Energy Information Agency (EIA) impact the price of WTI Oil. Changes in inventories reflect fluctuating supply and demand. If the data shows a drop in inventories it can indicate increased demand, pushing up Oil price. Higher inventories can reflect increased supply, pushing down prices. API’s report is published every Tuesday and EIA’s the day after. Their results are usually similar, falling within 1% of each other 75% of the time. The EIA data is considered more reliable, since it is a government agency.
OPEC (Organization of the Petroleum Exporting Countries) is a group of 13 Oil-producing nations who collectively decide production quotas for member countries at twice-yearly meetings. Their decisions often impact WTI Oil prices. When OPEC decides to lower quotas, it can tighten supply, pushing up Oil prices. When OPEC increases production, it has the opposite effect. OPEC+ refers to an expanded group that includes ten extra non-OPEC members, the most notable of which is Russia.
Author

Joshua Gibson
FXStreet
Joshua joins the FXStreet team as an Economics and Finance double major from Vancouver Island University with twelve years' experience as an independent trader focusing on technical analysis.


