|

Crude Oil eases despite Red Sea tensions, WTI slips back towards $74.00

  • WTI chipped lower as shipping continued through Red Sea despite new rebel attacks.
  • Crude bids are eating away at last week’s gains as shipping lanes remain open.
  • API, EIA stock figures slated for this week.

West Texas Intermediate (WTI) Crude Oil is easing back on Wednesday after last week’s 2%-plus gain on the back of transportation cancellations through the Red Sea following attacks on cargo ships by Iran-backed Houthi rebels in Yemen.

Houthi rebels have vowed to keep up the pace of attacks in the region, with Tuesday seeing an uptick in ship attacks, but logistics companies that previously suspended shipping lanes through the Yemen region of the Red Sea have returned to the area despite fresh attacks, sailing behind a joint task force that has settling into the region in an effort to quell rebel activity.

With Crude Oil production continuing to outpace declining barrel demand, even in the face of steepening production cuts from member states of the Organization of the Petroleum Exporting Countries (OPEC), and it’s organization of allies the OPEC+, Crude Oil continues to see stiff bearish pressure.

US Crude Oil stocks continue to flaunt expectations of declining reserves, and both the American Petroleum Institute (API) and the Energy Information Administration (EIA) will be publishing updated barrel buildup figures on Wednesday and Thursday, respectively.

The API Weekly Crude Oil Stocks count last posted a 939K barrel increase last week while the EIA Crude Oil Stocks Change last showed a buildup of nearly three million barrels, and is forecast to print a -2.6 million barrels reduction for the week ended December 22.

WTI Technical Outlook

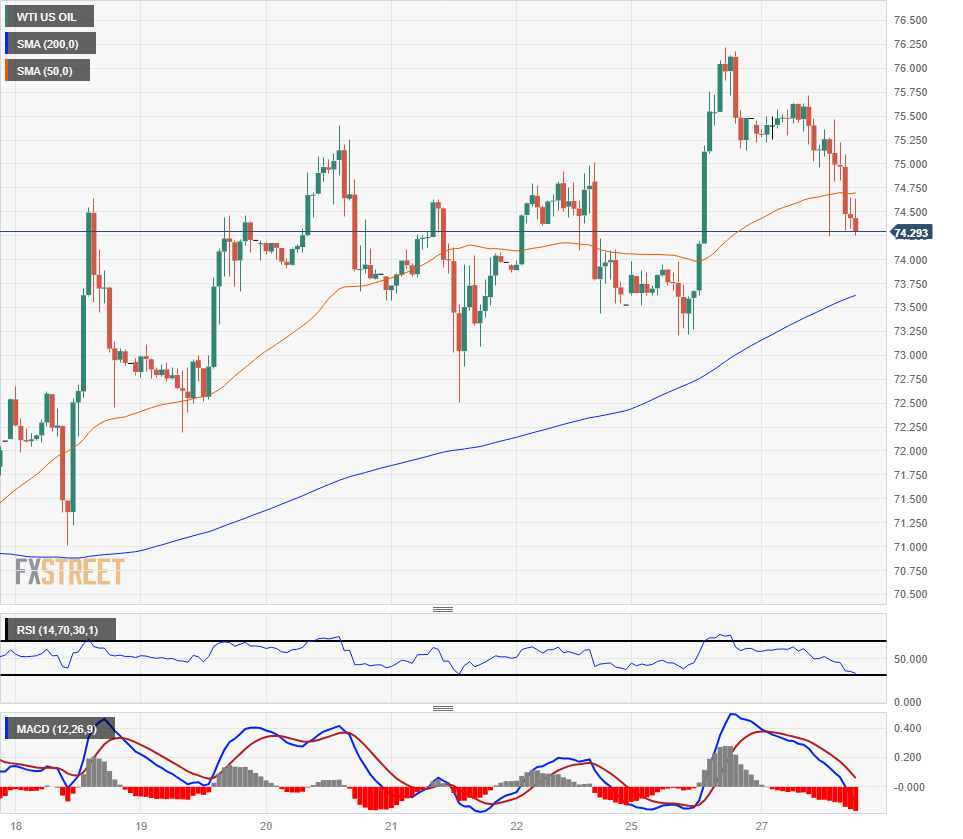
Near-term momentum continues to vex WTI, leeping prices pinned close to the 50-hour Simple Moving Average (SMA) as near-term bullish plays regularly run out of steam. US Crude Oil continues to trade on the north side of the 200-hour SMA, but the gap is closing quickly with the 200-day SMA rising into $73.50.

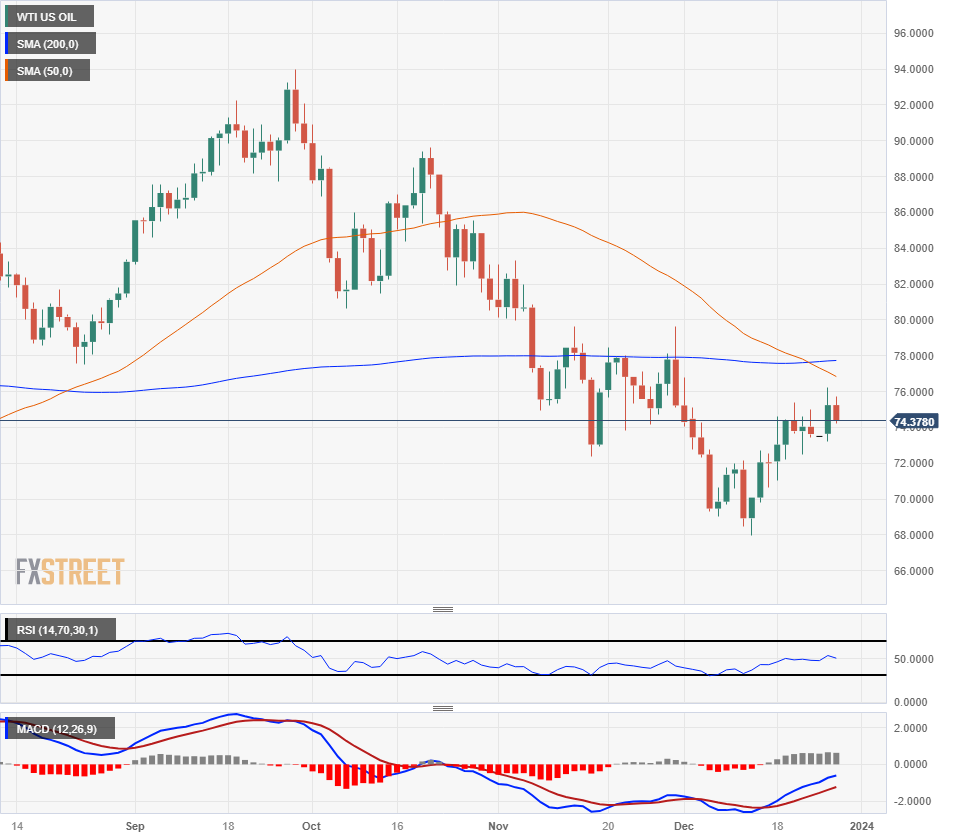
Oil bidders will be looking to gather enough steam to crach through the 200-day SMA currently floating near the $78.00 handle, while short sellers will note that WTI is approaching a technical confluence zone between familiar price peaks and a fresh bearish cross of the 50-day and 200-day SMAs just above $77.00.

WTI Hourly Chart
WTI Daily Chart
WTI Technical Levels

WTI US OIL

Overview
Today last price74.54
Today Daily Change-0.71
Today Daily Change %-0.94
Today daily open75.25
 
Trends
Daily SMA2072.82
Daily SMA5077.1
Daily SMA10081.08
Daily SMA20077.72
 
Levels
Previous Daily High76.22
Previous Daily Low73.21
Previous Weekly High75.41
Previous Weekly Low71.01
Previous Monthly High83.34
Previous Monthly Low72.39
Daily Fibonacci 38.2%75.07
Daily Fibonacci 61.8%74.36
Daily Pivot Point S173.56
Daily Pivot Point S271.88
Daily Pivot Point S370.55
Daily Pivot Point R176.58
Daily Pivot Point R277.91
Daily Pivot Point R379.59

Author

Joshua Gibson

Joshua joins the FXStreet team as an Economics and Finance double major from Vancouver Island University with twelve years' experience as an independent trader focusing on technical analysis.


More from Joshua Gibson
Share:

Editor's Picks

GBP/USD holds range near 1.3500 after UK Q2 GDP

GBP/USD keeps its range near the 1.3500 psychological mark in the European session on Thursday. The mixed UK GDP and industrial data failed to inspire the British Pound. Meanwhile, the US Dollar stabilizes after the US CPI data-led sell-off, checking any upside attempts in the pair.

EUR/USD flatlines above 1.1500 as US Dollar stablizes ahead of PPI

EUR/USD is trading modestly flat above 1.1500 in European trading hours on Thursday. The pair stalls its rebound as the US Dollar consolidates losses incurred after the release of July's Consumer Price Index report. Inflation in the US moderated across a broad range of goods and services, cooling expectations for an aggressive Federal Reserve rate hike in September and weighing on the Greenback. The US PPI data is next in focus.

Gold weakens further below $4,400 as USD sticks to gains amid Fed bets, Iran tensions

Gold extends its intraday retracement slide from the highest level since June 5, around the $4,450 area touched earlier this Thursday, and slides further below the $4,400 mark heading into the European session. The initial market reaction to signs of moderating US inflation fades quickly as investors remain worried that higher energy prices will rekindle inflationary pressures.

XRP holds at make-or-break level, ADA and SOL risk 50-day EMA breakout

Top altcoins, including Ripple, Cardano, and Solana, are facing downside pressure, holding at crucial support levels. The technical outlook for XRP, ADA, and SOL indicates a mild bearish bias as downside pressure mounts.

Gold has priced a Fed pause. The hike is still coming
July inflation landed exactly where the consensus had it, on all four lines of the release, and Gold responded by adding around 1% and holding fast near $4,400/ounce, trading at its highest since early June. A print that surprises nobody is not supposed to move a metal that far.
Why is Crude Oil priced for a reopening the ships haven't made?
Fourteen vessels crossed the Strait of Hormuz on Tuesday. Before the war, the count ran near 120 a day. In the sessions since the waterway was publicly declared open, Brent has drifted back to $87 and West Texas Intermediate (WTI) to $81, both a little lower again on Wednesday, with daily momentum on each unwound from the top of its range in late July to the low twenties now.