Crude Oil eases back on Wednesday, WTI falls back below $79 per barrel
- Crude Oil markets decline as investment sentiment recedes.
- Midweek market flows shed weight as Treasuries squeeze out risk appetite.
- WTI stumbles after hitting three-week highs.

West Texas Intermediate (WTI) US Crude Oil fell back on Wednesday, trimming recent gains and snapping a three-day bullish streak and falling back below $80.00 per barrel. Broad-market risk appetite is evaporating in the mid-week as investors balk at declining demand for US Treasuries and energy markets grow concerned ahead of US Crude Oil production counts.
Demand for US Treasuries declined this week, with bid-to-cover ratios on key bond auctions declining. Jittery investors are growing concerned about demand for US Treasuries, and pulling away from risk assets in search of safer pastures. The bid-to-cover on Wednesday’s 7-year Trasury note auction declined to 2.43 versus the previous 2.48.
The Organization of the Petroleum Exporting Countries (OPEC) and its extended network of non-member allies, OPEC+, are due to begin an online-only meeting this Sunday on June 2, and energy markets are broadly anticipating that OPEC+ will maintain voluntary production caps of a total 2.2 million bpd as the oil cartel grapples with supporting global Cruide Oil prices by crimping supply.
US Crude Oil production, meanwhile, continues to threaten to swamp out demand, and barrel traders are looking ahead to US Crude Oil barrel counts due this week.
Economic Indicator
EIA Crude Oil Stocks Change
The EIA Crude Oil stockpiles report is a weekly measure of the change in the number of barrels in stock of crude oil and its derivates, and it's released by the Energy Information Administration. This report tends to generate large price volatility, as oil prices impact on worldwide economies, affecting the most, commodity related currencies such as the Canadian dollar. Despite it has a limited impact among currencies, this report tends to affect the price of oil itself, and, therefore, had a more notorious impact on WTI crude futures.
Read more.Next release: Thu May 30, 2024 15:00
Frequency: Weekly
Consensus: -1.9M
Previous: 1.825M
WTI technical outlook
WTI US Crude Oil fell back under $80.00 per barrel on Wednesday, and crossing below the 200-day Exponential Moving Average (EMA) at $79.16. Crude Oil ius poised to end i nthe red for the first time in four straight trading days, and WTI remains down over 9% from the year’s peak bids just above $87.00.
WTI daily chart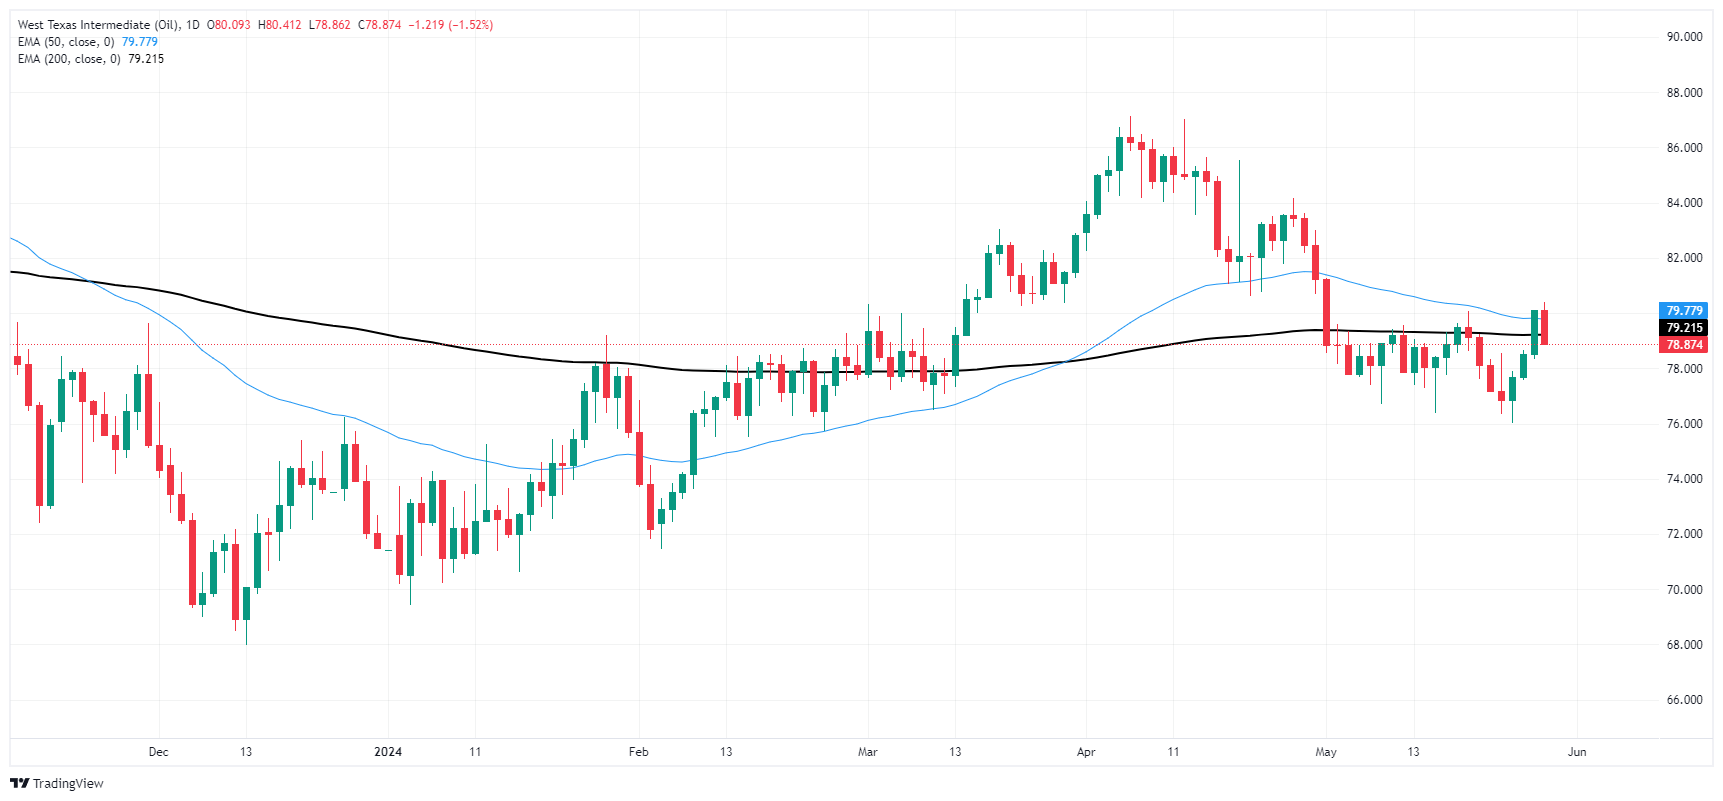
Author

Joshua Gibson
FXStreet
Joshua joins the FXStreet team as an Economics and Finance double major from Vancouver Island University with twelve years' experience as an independent trader focusing on technical analysis.


