|

Constellation Energy (CEG) riding the renewable energy bullish wave

Amid the global momentum toward sustainable energy, Constellation Energy (CEG) stands out as a dynamic player in the renewable sector. In this article, we explore CEG’s recent performance, analyze its technical structure, and highlight its promising potential for further growth.

Following its spinoff from Exelon Corporation (EXC) on February 1, 2022, Constellation Energy Corporation (CEG) commenced trading as an independent entity. Since then, CEG has actively participated in the stock market, experiencing a remarkable 160% increase.

CEG Elliott Wave weekly chart 11.17.2023

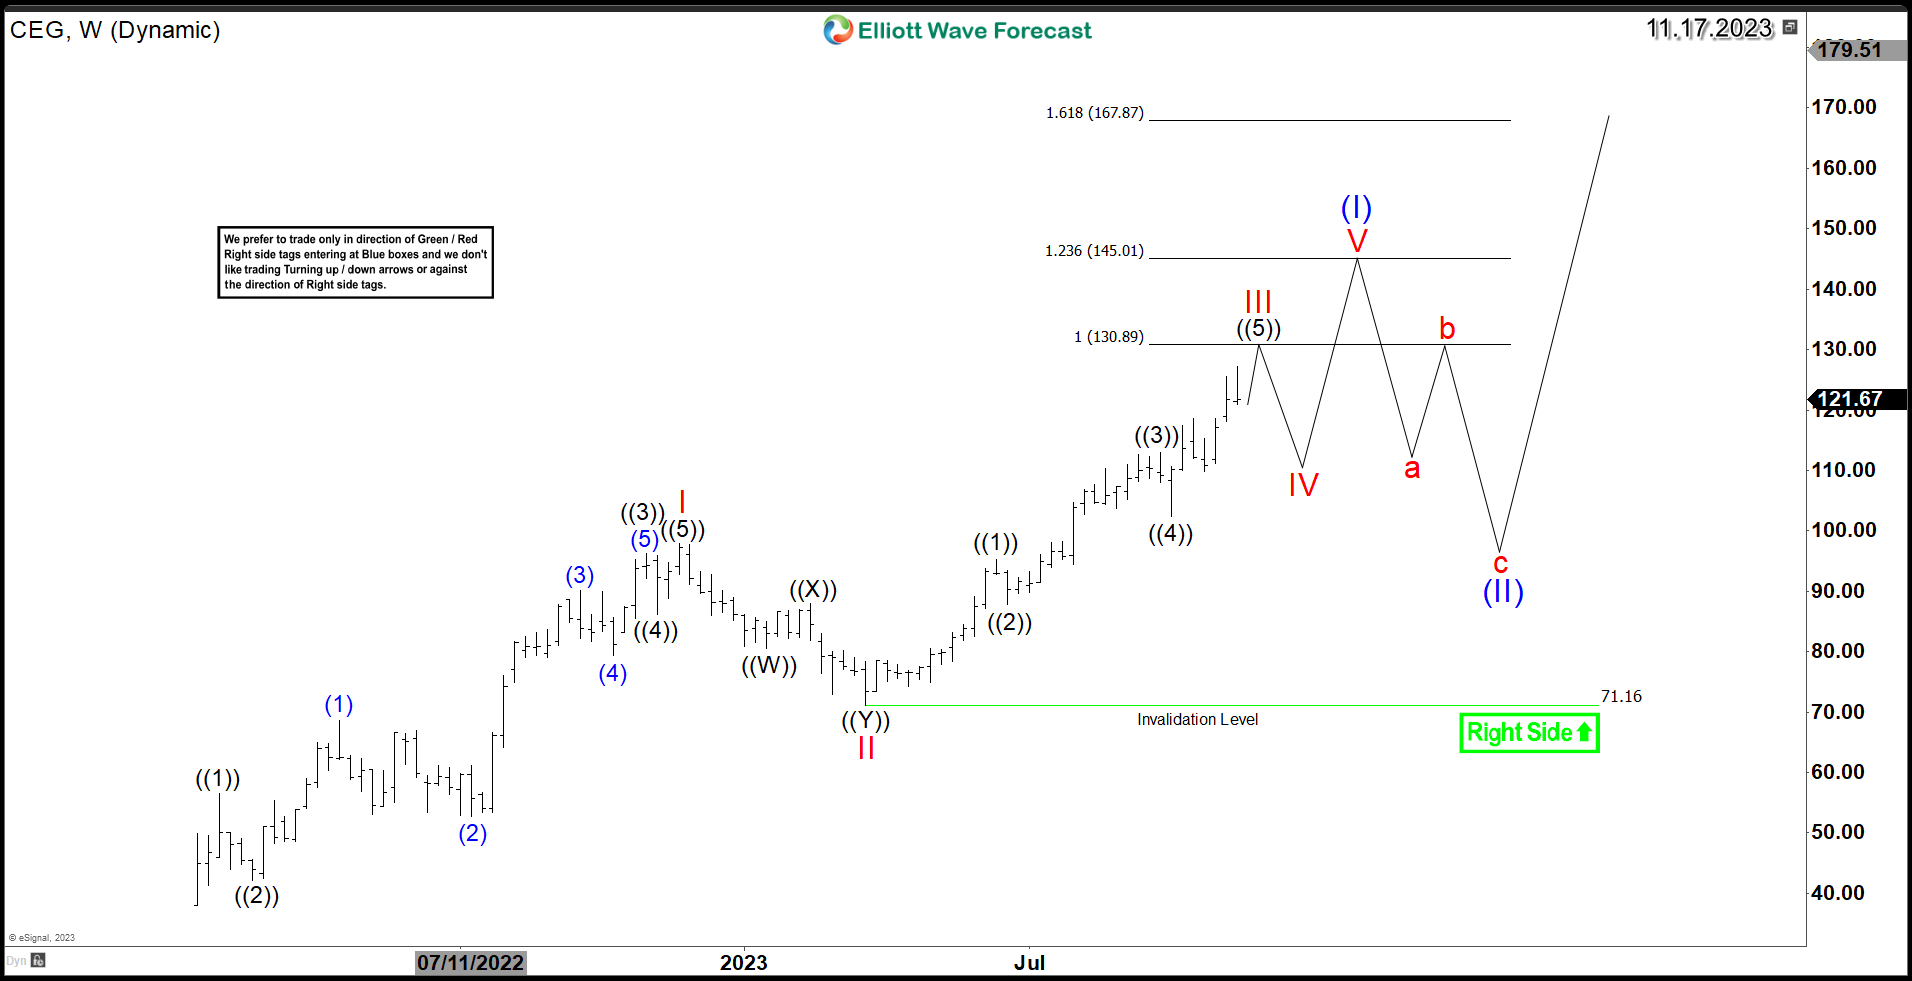
The stock rally, which has been unfolding since last year, follows an impulsive structure. Currently, it remains within wave III, targeting the equal legs area between $130 and $145. Anticipate a 3-wave pullback in wave IV before another upward rally to complete wave V of wave (I).

The bullish structure is anticipated to provide support for the stock during the upcoming daily correction wave (II). This correction phase ideally presents a buying opportunity for long-term investors, as the stock is poised to resume its trend within another impulsive rally.

In summary, Constellation Energy Corporation (CEG) leads the charge in the renewable energy revolution. Its spinoff from Exelon Corporation (EXC) was a pivotal moment, propelling the stock into impulsive waves. Investors should keep an eye out for buying opportunities during corrective phases. With unwavering commitment to clean energy and a dynamic market presence, CEG shines as a beacon for long-term growth in our ever-evolving energy landscape.

Author

Elliott Wave Forecast Team

Elliott Wave Forecast Team

ElliottWave-Forecast.com

More from Elliott Wave Forecast Team
Share:

Editor's Picks

EUR/USD loses ground below 1.1850 ahead of FOMC Minutes

The EUR/USD pair loses traction near 1.1840 during the early European session on Wednesday, pressured by renewed US Dollar demand. Traders brace for the Federal Open Market Committee Minutes for signals on future rate cuts, which will be released later on Wednesday. 

When is the UK CPI data and how could it affect GBP/USD?

The United Kingdom Consumer Price Index data for January is scheduled to be published today at 07:00 GMT. GBP/USD trades slightly lower at around 1.3556 as of writing. The 20-period Exponential Moving Average trends lower at 1.3593 and continues to cap rebounds. Price holds beneath this gauge, maintaining a short-term bearish bias.

Gold: Is the $5,000 level back in sight?

Gold snaps a two-day downtrend, as recovery gathers traction toward $5,000 on Wednesday. The US Dollar recovers from the overnight sell-off as rebalancing trades resume ahead of Fed Minutes. The 38.2% Fib support holds on the daily chart for now. What does that mean for Gold?

Pi Network rally defies market pressure ahead of its first anniversary

Pi Network is trading above $0.1900 at press time on Wednesday, extending the weekly gains by nearly 8% so far. The steady recovery is supported by a short-term pause in mainnet migration, which reduces pressure on the PI token supply for Centralized Exchanges. The technical outlook focuses on the $0.1919 resistance as bullish momentum increases.

UK jobs market weakens, bolstering rate cut hopes

In the UK, the latest jobs report made for difficult reading. Nonetheless, this represents yet another reminder for the Bank of England that they need to act swiftly given the collapse in inflation expected over the coming months. 

Top 3 Price Prediction: Bitcoin, Ethereum, and Ripple face downside risk as bears regain control

Bitcoin, Ethereum, and Ripple remain under pressure on Wednesday, with the broader trend still sideways. BTC is edging below $68,000, nearing the lower consolidating boundary, while ETH and XRP also declined slightly, approaching their key supports.