COL stock analysis and Elliott Wave technical forecast [Video]
![COL stock analysis and Elliott Wave technical forecast [Video]](https://editorial.fxsstatic.com/images/i/Equity-Index_S&P500-2.jpg)
COLES GROUP LIMITED – COL Elliott Wave Technical Analysis TradingLounge.
Greetings, our latest Elliott Wave analysis for the Australian Stock Exchange (ASX) highlights COLES GROUP LIMITED – COL. The current outlook suggests that ASX:COL may advance within the (5)-orange wave.
There exists some ambiguity between the two primary perspectives. However, readers can rely on key indicators to determine whether a bullish trend is commencing or if the bearish trend remains dominant, based on a logical and data-driven approach.
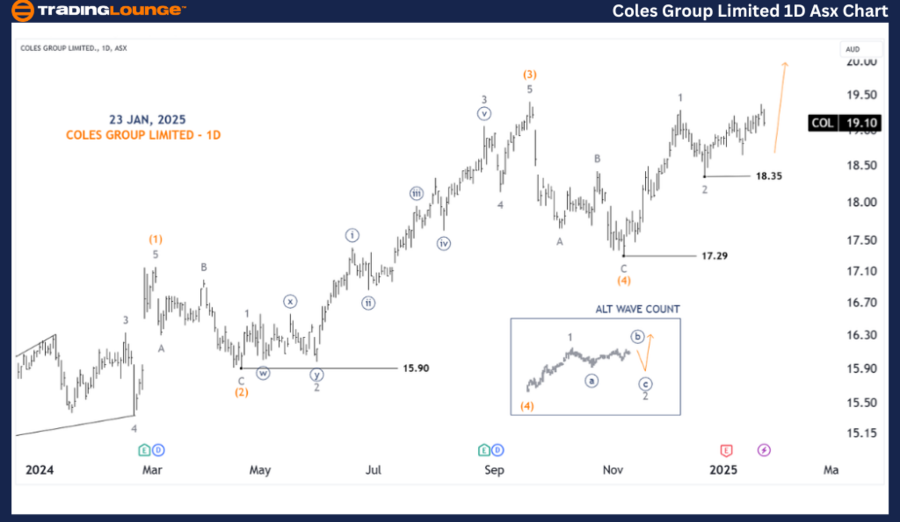
COL (1D chart) Elliott Wave technical analysis
-
Function: Major trend (Minute degree, navy).
-
Mode: Motive.
-
Structure: Impulse.
-
Position: Wave 3-grey of Wave (5)-orange.
Details:
The primary wave count scenario suggests that the 3-grey wave is trending upward from 18.35. However, this outlook has weakened due to insufficient clarity and strength in the movement. As a result, the ALT alternative scenario is gaining prominence. It is essential to monitor this stock further for confirmation.
-
Invalidation point: 17.29
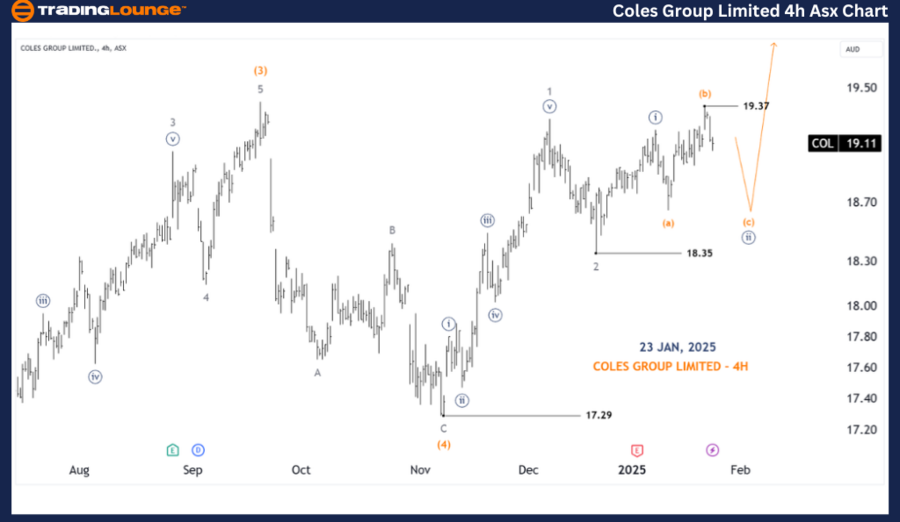
COL 4-hour chart analysis
Function: Major trend (Minor degree, grey).
Mode: Motive.
Structure: Impulse.
Position: Wave 3-grey of Wave (5)-orange.
Details:
As previously mentioned, there is noticeable weakness in the upside momentum. This could indicate a developing 2-grey wave. However, if the stock surpasses 19.37, it would strengthen the primary outlook. Otherwise, both scenarios hold comparable probabilities.
-
Invalidation point: 18.35.
-
Confirmation point: 19.37.
Conclusion
Our analysis provides a comprehensive forecast of market trends and short-term expectations for COLES GROUP LIMITED – COL. We deliver insights to help investors navigate the market effectively, offering specific price points that serve as validation or invalidation markers for our Elliott Wave counts. This approach enhances confidence in our market outlook.
By considering these factors, we aim to provide a well-balanced, professional perspective on the current market landscape.
Technical analyst: Hua (Shane) Cuong, CEWA-M (Master’s Designation).
COL Elliott Wave technical analysis [Video]
Author

Peter Mathers
TradingLounge
Peter Mathers started actively trading in 1982. He began his career at Hoei and Shoin, a Japanese futures trading company.


