Cisco (CSCO) Elliott Wave suggests ideal entry for optimal profit

Welcome to another blog post on trade setups. In this one, the spotlight is on CISCO under the ticker CSCO. The stock has been in a bullish sequence for many months. Thus, the current pullback could present a good entry opportunity for buyers. Later in the post, I indicated the ideal buying zone traders might consider.
Cisco Systems, Inc. (CSCO) is a multinational technology company specializing in networking hardware, software, cybersecurity, and cloud solutions. Headquartered in San Jose, California, Cisco serves global enterprises and governments, enabling digital connectivity and security. Its stock trades on the NASDAQ under the ticker CSCO and is a major component of the S&P 500 index.
CSCO has been in a clear bullish sequence after the sell-off between March 2000 and October 2022, which saw the stock shed 90%. It fell from around $82 at its all-time high to just $8 in 30 months. Since the October 2022 low, the stock has not been able to make a new record high. However, there has been over a 90% recovery so far. Thus, sooner or later, a new high is likely within the bullish sequence from October 2022.
CSCO Elliott Wave setup – 13-October-2025
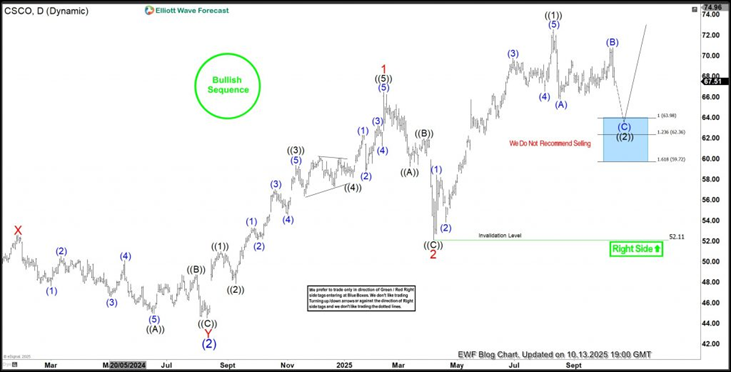
From an Elliott Wave perspective, the cycle from October 2002 is developing as an impulse wave structure. However, the structure is yet to complete. The super-cycle degree waves (1) and (2) ended in September 2023 and August 2024, respectively. From the August 2024 low, wave 1 of (3) started and ended at the February 2025 high. Afterwards, a pullback for wave 2 of (3) followed into April 2025, where the current bullish cycle began across the global stock market, especially in the U.S. markets. As the daily chart below shows, wave ((1)) of 3 emerged from the April 2025 low and breached the February 2025 top to establish a new high within the October 2022 cycle. Wave ((1)) ended at the August 2025 high, where wave ((2)) started to correct it. This is a typical case of a bullish market—higher highs and higher lows sequence.
The chart above shows the pullback for wave ((2)) of 3 of (3) unfolding as a simple zigzag structure. At the 63.98–59.72 area, we have the blue box. The blue box on our chart highlights where the pullback is expected to end for a bounce within the bullish sequence. Thus, this zone should attract buyers for at least a 3-swing bounce or potentially a full bullish cycle for wave ((3)) of 3, with the potential to reach $70–97. The next bullish cycle could take CSCO to fresh record highs, presenting an excellent opportunity for traders to buy below $65. Typically, we prefer to enter long around $64 with a stop at $59, risking $5 to target $16–$33 — a 1:3 to 1:6 risk-to-reward ratio.
Author

Elliott Wave Forecast Team
ElliottWave-Forecast.com


