Chart of the week in Analysis: AUD/JPY at a critical juncture
- AUD/JPY is a compelling case for a test of trendline support.
- Upside targets include the 200-DMA and July highs.

Considering the fundamental backdrop, as explained in full here, Asia open: Recap of latest developments as risk-on tones emerge and here, What you need to know before markets open: Eyes on USD/JPY test below trend-line support, AUD/JPY brings in a compelling technical story that has something for both the bears and the bulls at the start of this week.
AUD/JPY is an eye-catcher for the start of this week. The market's risk-barometer is technically running out of juice on the downside, as signified by MACD and a lack of conviction from the bears as signified by the indecisiveness on the last daily candlestick and price action since the 14th Nov. lows.
Bears look for initial 'fakeout'
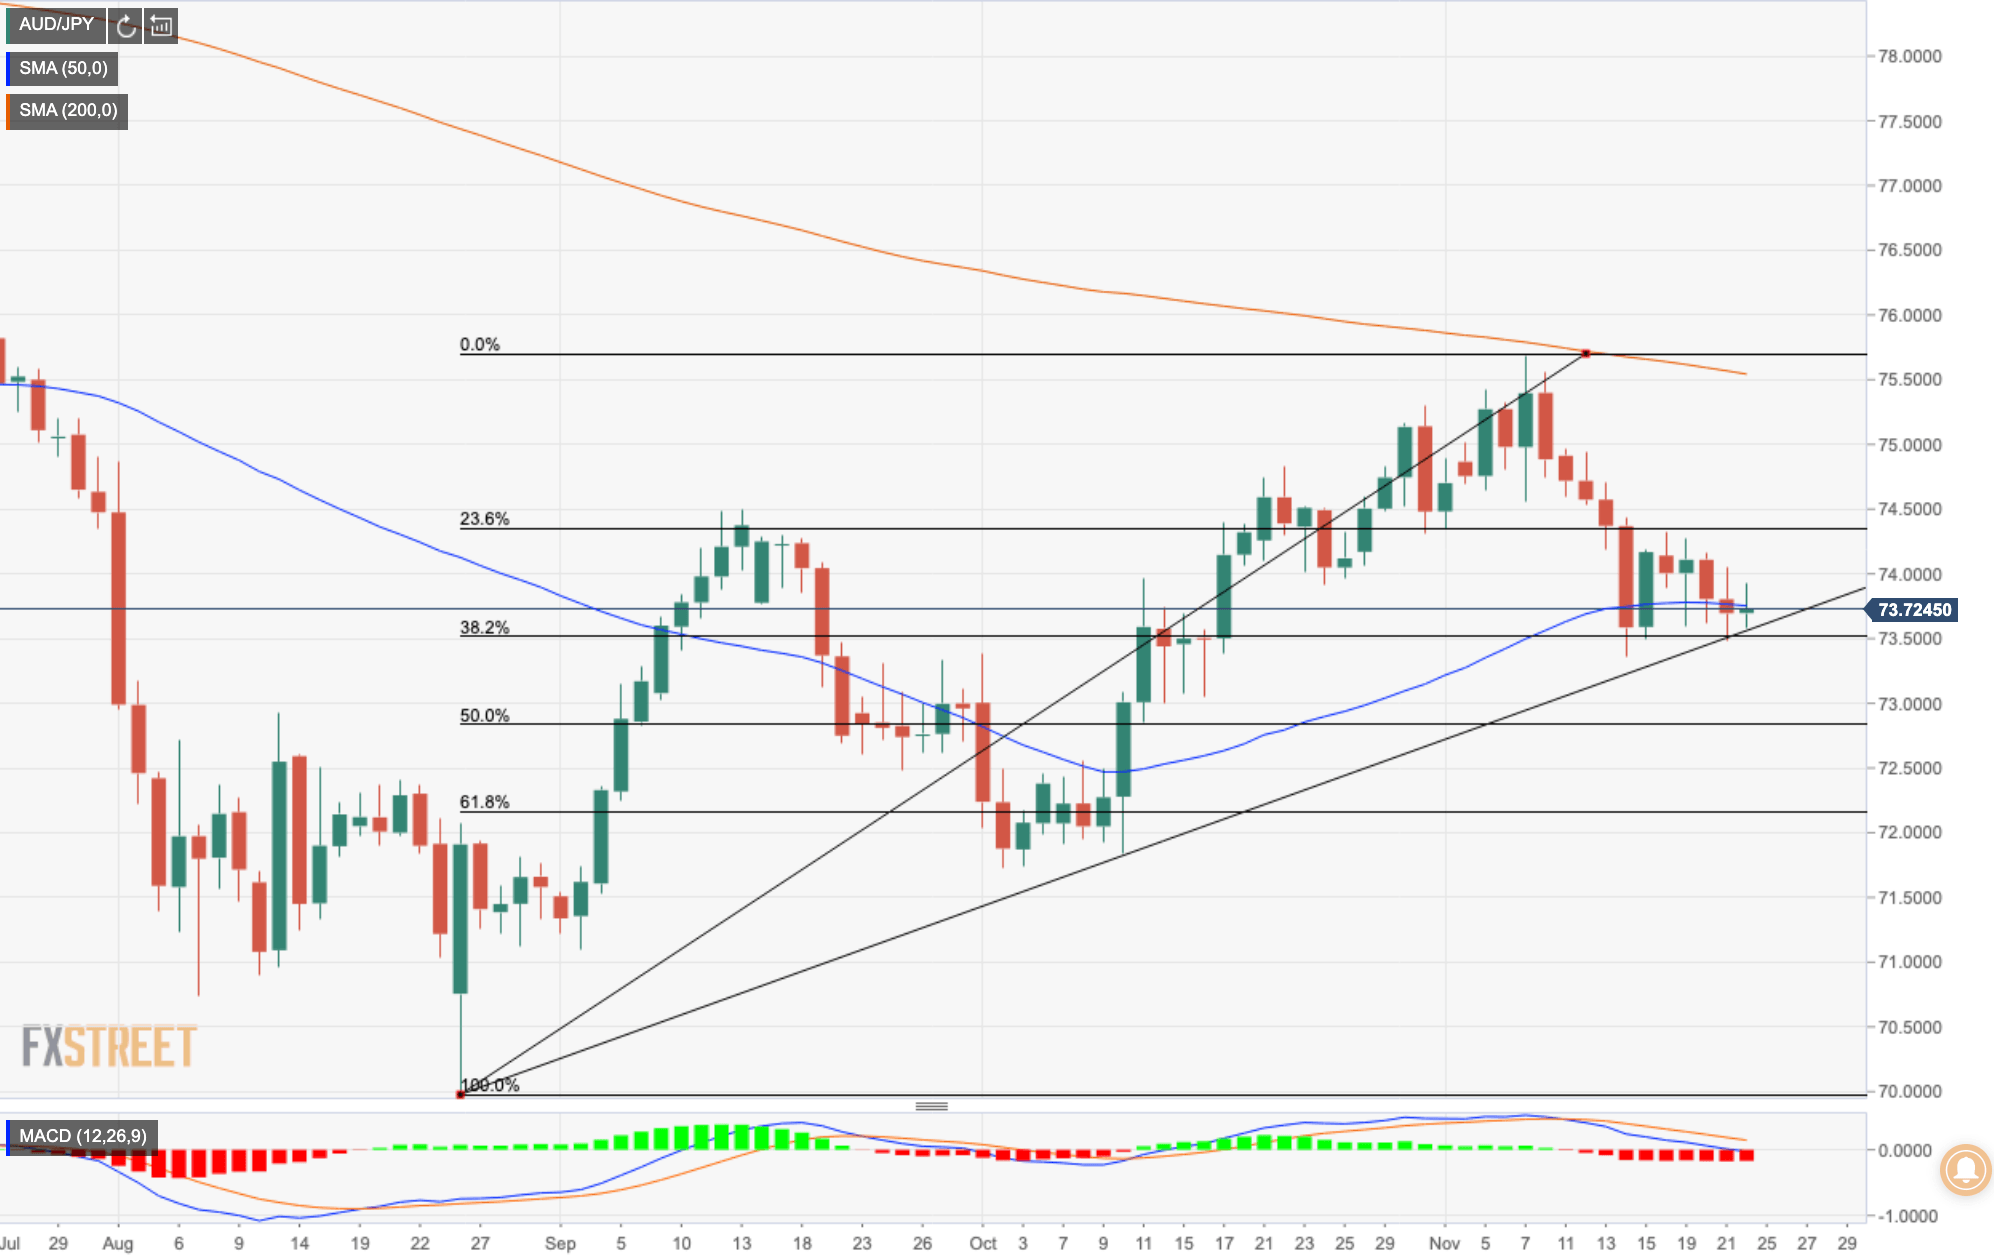
Trendline support is being respected at this juncture where the price meets the 38.2% Fibonacci retracement of the 26th Aug. - 7th Nov. range. However, it would not be uncommon for a test below the trendline at this juncture which would bring in 73 the figure prior to a re-run to the upside and prior trendline support level again. A high conviction trade, subsequently, could be if the price were to break the 73 handle on a second attempt, bears will be looking down the barrel to the October lows as a target at 71.73. However, the 61.8% Fibonacci would be an obstacle around 72.20 guarding a highly congested range between there and a figure lower to the 78.6% Fibo/ located around 71.20.
Upside targets
On the flip side, bulls need a break above the 21-day moving average ad then a close or two through and beyond the 13th Sep. swing highs located at 74.49 with a confluence of the 23.6% Fibo of the aforementioned rage. The 200-day moving average is located at the latest swing highs of 75.67. A break of the July-Aug congestion/resistance of 76.28 opens risk fo 77.40, (Feb spike lows) ahead of 78.50 26th Oct 18 lows.
AUD/JPY daily chart
Author

Ross J Burland
FXStreet
Ross J Burland, born in England, UK, is a sportsman at heart. He played Rugby and Judo for his county, Kent and the South East of England Rugby team.


