Cautious trading ahead – S&P 500 faces global headwinds and policy divergence

The E-mini S&P 500 is trading cautiously amid rising global tensions and domestic economic uncertainty. Recent U.S. tariff threats against 14 countries have spooked investors, raising fears of retaliatory measures and inflationary pressures heading into the third quarter. Corporate earnings expectations are being revised downward as supply chain disruptions loom. The latest FOMC minutes showed internal disagreement on the interest rate path—some members support a cut by September, while others remain cautious due to sticky inflation data.
Rising energy costs are amplifying inflation fears and flattening the U.S. yield curve, leading to valuation compression in high-beta sectors like tech. Meanwhile, a stronger U.S. dollar continues to pressure multinational earnings and fuel a flight to safe havens like gold.
Market dynamics are also being shaped by seasonal patterns. July through August is historically a volatile period, with low liquidity increasing the probability of outsized moves. Deutsche Bank and other institutions have flagged this window as particularly vulnerable to corrections. ETF flows and COT positioning indicate early-stage de-risking by institutional investors, while retail sentiment remains overly bullish.
Technically, the S&P 500 is consolidating between 6,250 and 6,330, with a breakout above 6,350 needed to reestablish bullish momentum. A breach below 6,250 could trigger a wave of profit-taking. The broader sentiment remains risk-off due to geopolitical frictions, high interest rates, and uncertain Fed policy direction. Traders are advised to remain flexible, emphasizing short-duration trades and reactive strategies. Inflation metrics, energy markets, central bank signals, and global politics will dominate the trading landscape through July. The near-term outlook remains cautiously bearish, with a neutral-to-stabilizing bias projected toward late Q3.
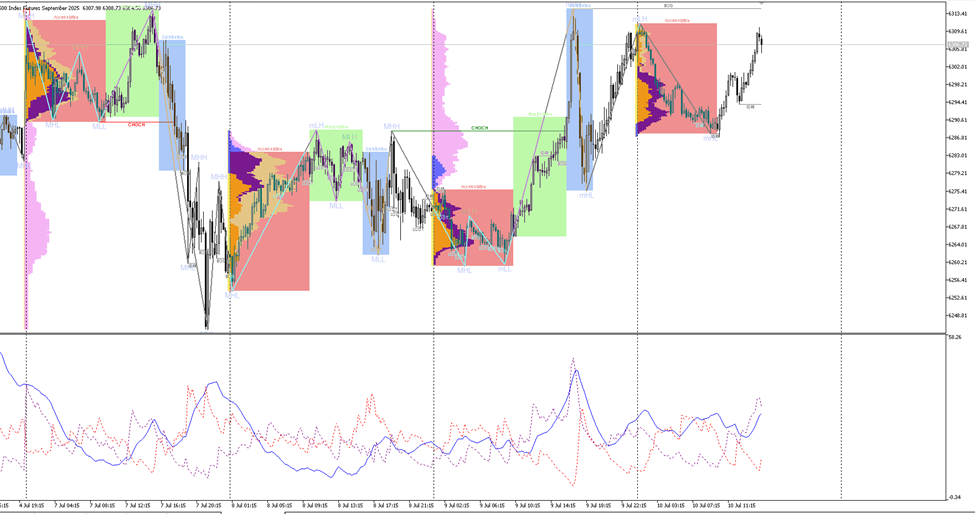
ICT market structure and volume profile
The market began the week with a significant liquidation phase, marked by a clear Change of Character (CHoCH) at the 6292 level. This initiated a sequence of bearish structure breaks and lower highs (mLH) and lower lows (mLL), indicating a temporary redistribution phase within the overall bullish macro trend.
As the decline reached exhaustion, price reversed sharply from a high-volume node around the 6260–6265 level. This recovery phase was supported by multiple signs of liquidity grabs below prior lows, followed by clean imbalance fills (IDM) and price expansion from fair value gaps (FVGs).
A notable bullish CHoCH then emerged around 6282–6285, confirming a shift in sentiment and market direction. This transition was further validated by the formation of higher lows (mHL) and a break of internal structure (BOS) toward the upside.
Currently, price is consolidating above 6305, showing signs of strength as it approaches the 6312–6315 area, which represents a previous structural high and low-volume resistance zone.
Gann vibration and harmonic cycles
The July 9–10 low aligns with the 90-degree angle from a prior significant swing at 6165, based on the Square of Nine vibration model. This reinforces the idea that the 6234 zone was a natural harmonic support.
Gann angles drawn from prior tops and bottoms also intersect near 6338–6345, forming a critical time/price confluence area. These levels represent possible resistance in the upcoming sessions, especially if price meets the 45° and 270° vibration zones simultaneously.
In terms of time cycles, a 144-hour (9 trading day) count from the last impulse low is set to complete on July 12, which may introduce a reaction or pause.
Forward-looking price zones and projections
| Level | Description |
| 6395 | Major Gann resistance, statistical upper band, potential exhaustion zone |
| 6312–6315 | Key structural high and liquidity target; watch for reaction |
| 6262 | Point of control (POC); volume-based support |
| 6234 | Imbalance zone and previous CHoCH support; crucial for bullish continuation |
| 6212 | Invalidates short-term bullish outlook if broken with volume |
The current market setup for the E-mini S&P 500 futures leans bullish in the short term, driven by:
-
Technical confirmation via ICT structure and CHoCH/BOS alignment
-
Impulsive wave patterns emerging from harmonic support
-
Reinforced by macro dovishness from FOMC and soft-landing expectations
However, caution is advised near the 6395 region, where Gann time/price confluence, statistical resistance, and macro uncertainty converge.
Price retracement toward 6245 may offer optimal long entries, while a clean break above 6315 may trigger momentum trades targeting 6380 and beyond.
E-mini S&P 500 futures exhibit a constructive short-term bullish bias, supported by technical alignment, harmonic impulse structure, and a dovish macro backdrop. Traders should watch for potential retracements toward 6245 as favorable long entry zones, while a decisive break above 6315 could validate momentum trades aiming for 6380+ levels. Tactical flexibility remains key as broader uncertainties persist.
Author

Faysal Amin
Mind Vision Traders
Faysal Amin is a seasoned financial analyst and market strategist with over a decade of experience in global markets, including equities, forex, and commodities.


