Caterpillar Inc (CAT): Trading higher within a wave (III), target above $600.00 [Video]
![Caterpillar Inc (CAT): Trading higher within a wave (III), target above $600.00 [Video]](https://editorial.fxstreet.com/images/TechnicalAnalysis/ChartPatterns/Candlesticks/digital-tablet-with-stock-charts-30235834.jpg)
Caterpillar Inc., commonly known as CAT, is a leading American manufacturer of construction and mining equipment, diesel and natural gas engines, industrial gas turbines, and diesel-electric locomotives. Caterpillar operates globally and is known for its extensive product line, which includes machinery like bulldozers, excavators, wheel loaders, and haul trucks. Below we will look at the long term Elliott Wave outlook of the company.
Caterpillar quarterly Elliott Wave chart
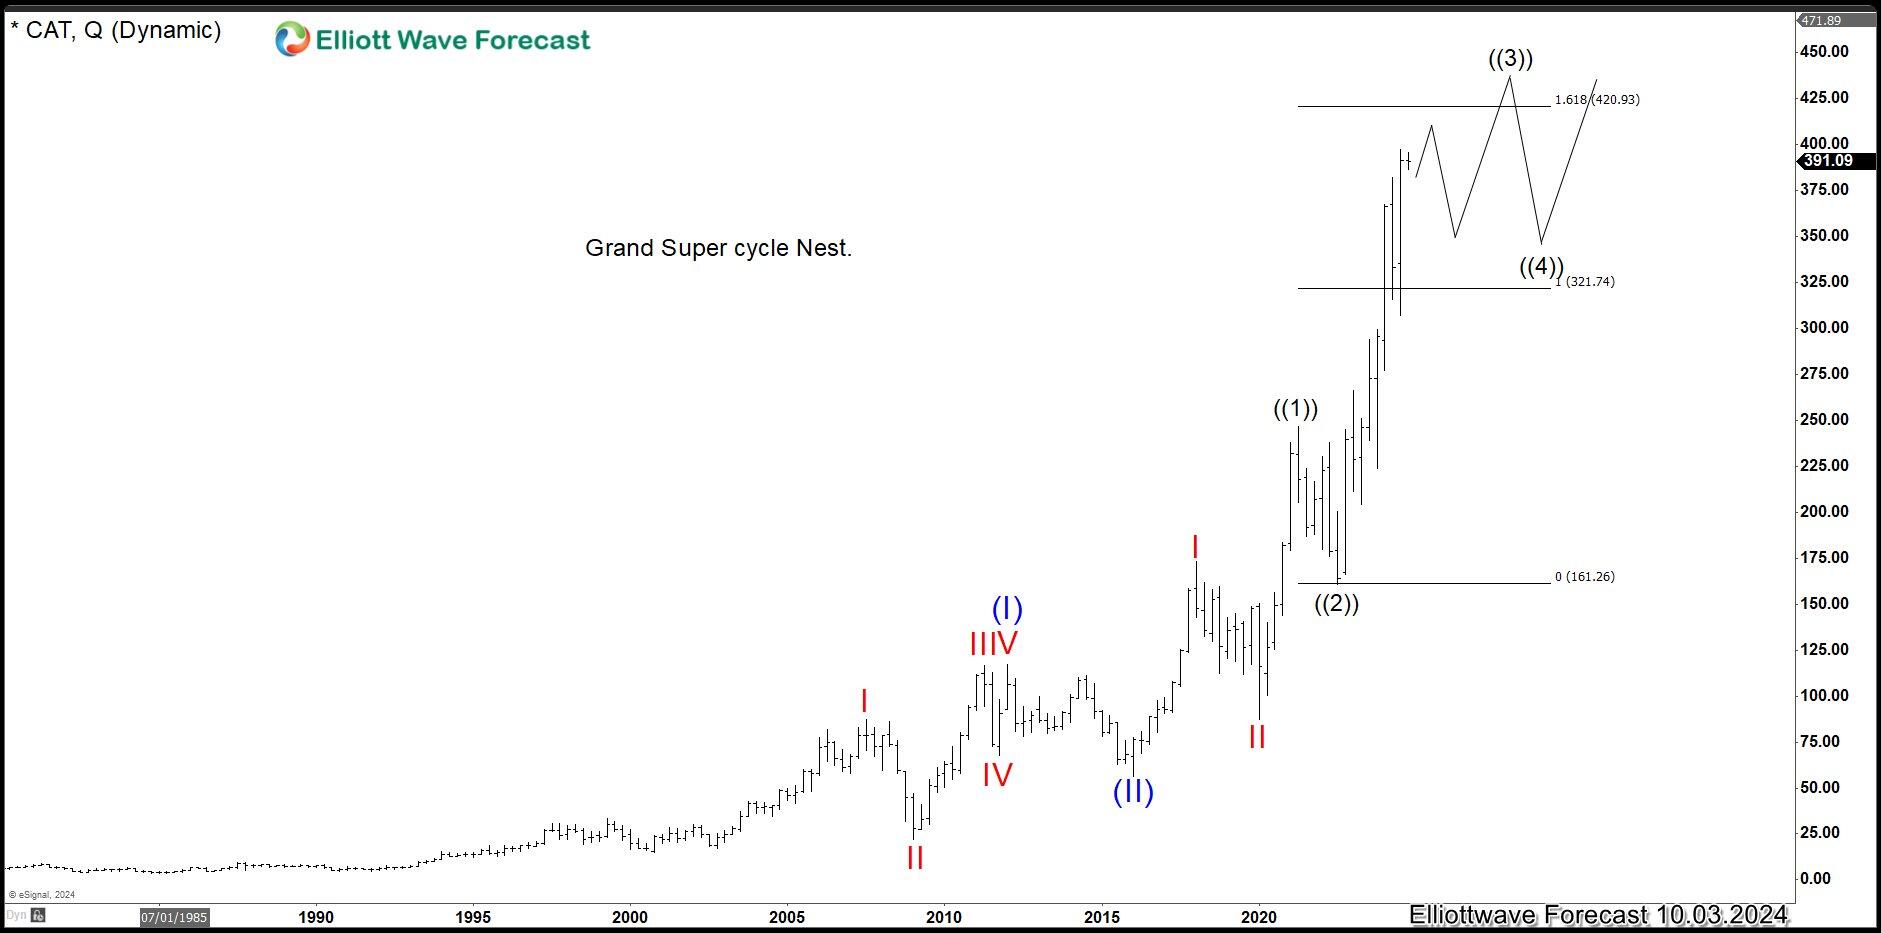
Quarterly Elliott Wave chart of Caterpillar above (CAT) shows that the stock extended higher strongly within wave (III). The subdivision of wave (III) is unfolding as a nesting 5 waves impulse. Up from wave (II), wave I ended at 173.24 and dips in wave II ended at 87.50. The stock nested higher in wave III with wave ((1)) ended at 246.69 and pullback in wave ((2)) ended at 160.60. Stock should continue to extend higher and dips to find support in 3, 7, 11 swing as the stock continues to extend higher in impulsive structure.
Weekly Caterpillar (CAT) Elliott Wave chart
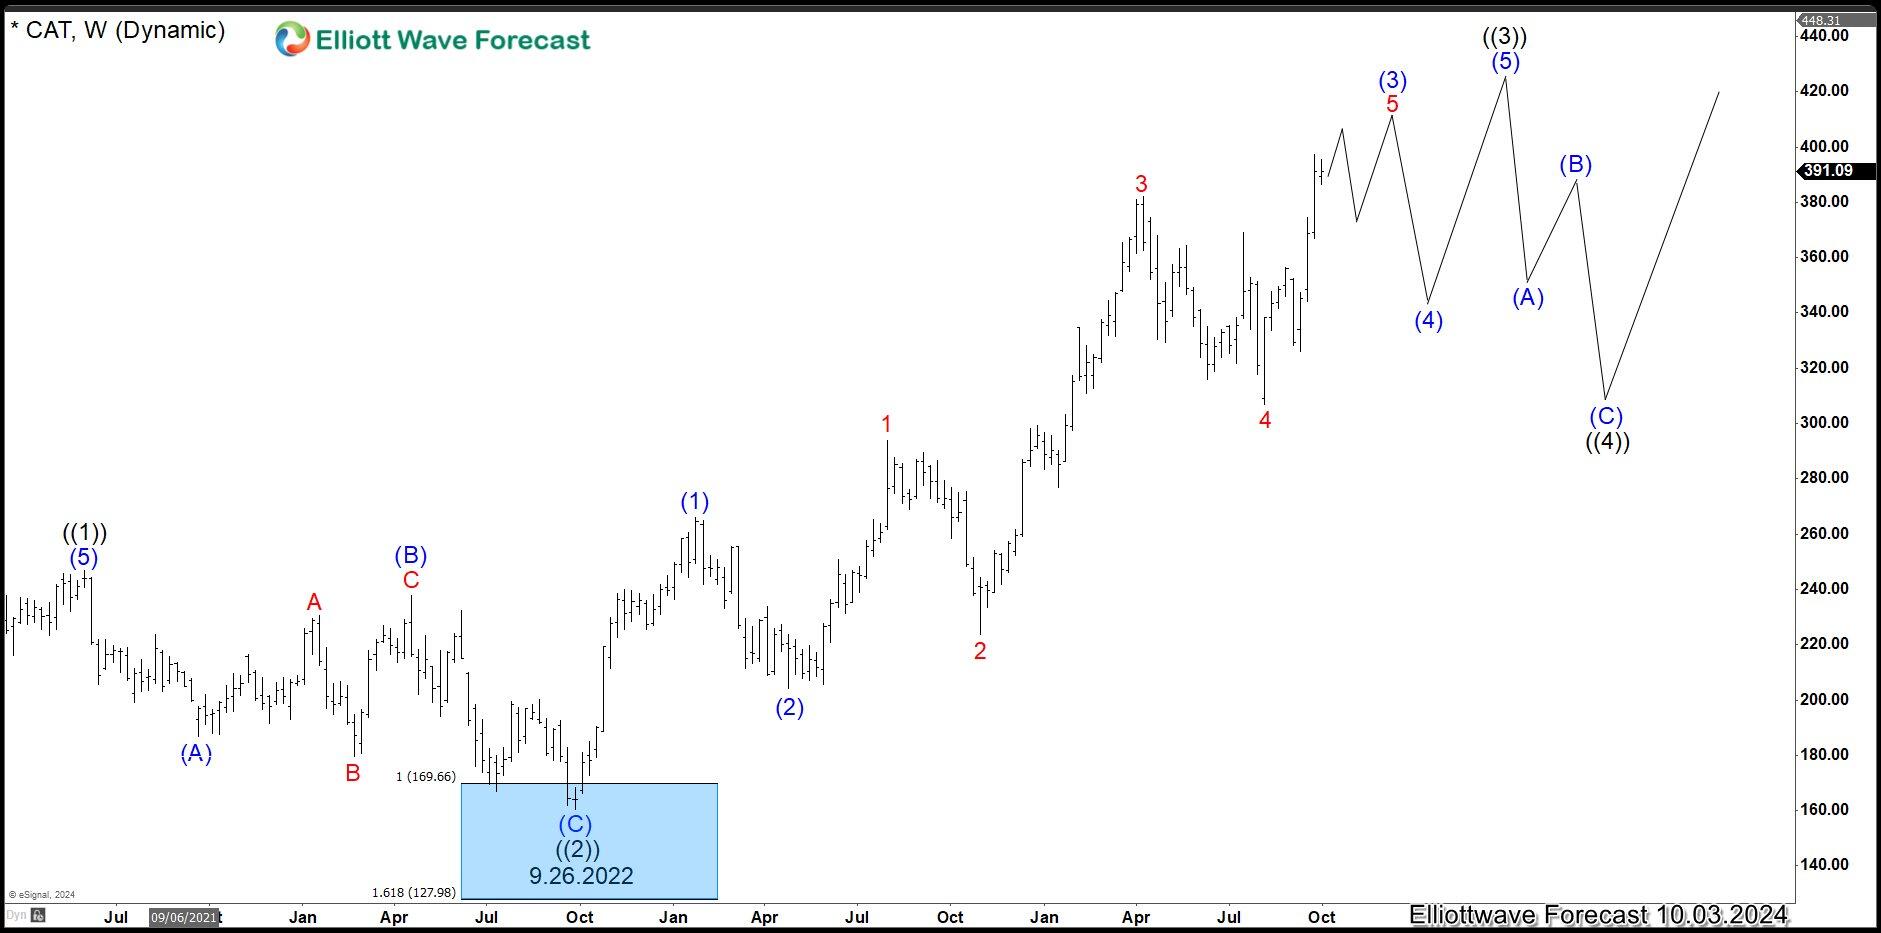
Weekly Elliott Wave chart of Caterpillar (CAT) above shows that pullback to 160.6 ended wave ((2)) on September 26, 2022. Stock has resumed higher in wave ((3)) with internal subdivision as an impulse. Up from wave ((2)), wave (1) ended at 266.04 and pullback in wave (2) ended at 204.04. Stock rallied higher as a nesting impulse. Wave 1 ended at 293.88 and wave 2 dips ended at 223.76. Wave 3 higher ended at 382.01 and pullback in wave 4 ended at 307.05. Expect the stock to continue to extend higher in the impulsive structure.
Caterpillar (CAT) Elliott Wave [Video]
Author

Elliott Wave Forecast Team
ElliottWave-Forecast.com


