Caterpillar Inc. (CAT) Elliott Wave analysis [Video]
![Caterpillar Inc. (CAT) Elliott Wave analysis [Video]](https://editorial.fxsstatic.com/images/i/Equity-Index_CAC40-2.jpg)
CAT Elliott Wave Analysis Trading Lounge.
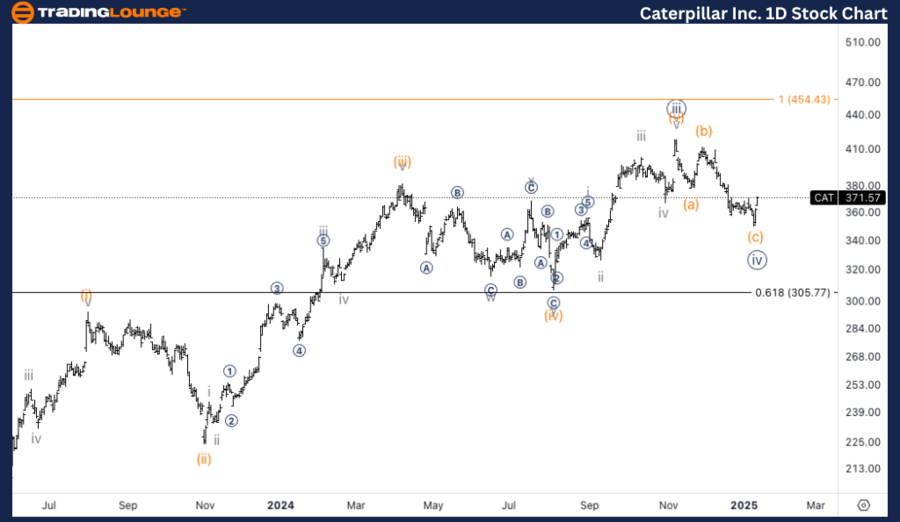
Caterpillar Inc., (CAT) Daily Chart.
CAT Elliott Wave technical analysis
Function: Counter Trend.
Mode: Corrective.
Structure: Complex.
Position: Wave {iv} of 3.
Direction: Bottom in {iv}.
Details: We could have a wave {iv} in place which would suggest the trend is strong. If not we could have completed wave (a) of {iv}.
CAT Elliott Wave technical analysis – Daily chart
Caterpillar Inc. (CAT) is showing signs of a possible bottom formation in wave {iv}, indicating that the overall trend remains strong. If this wave {iv} is complete, we could soon resume the uptrend into wave 5. However, there’s also a possibility that we’ve only finished wave (a) of {iv}, signaling a deeper correction before the uptrend resumes. A decisive move will help clarify the path forward.
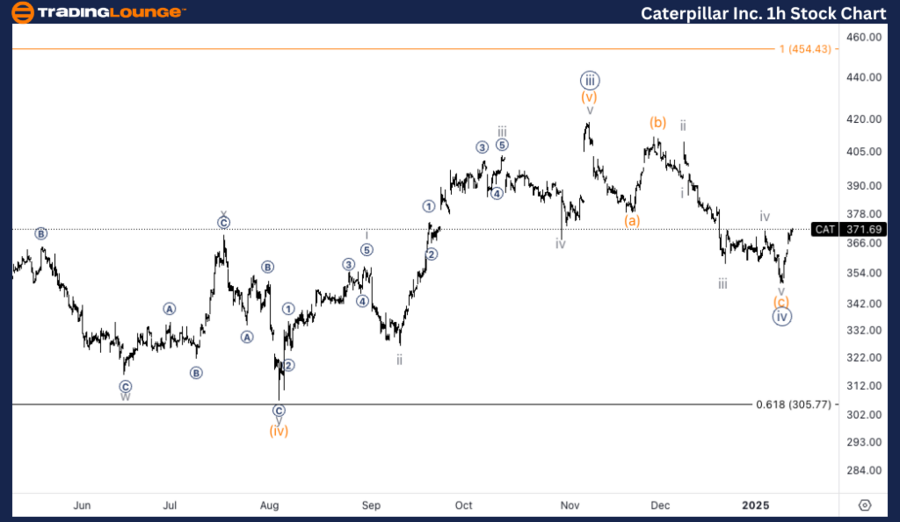
CAT Elliott Wave technical analysis
Function: Counter Trend.
Mode: Corrective.
Structure: Complex.
Position: Wave {i} of 5.
Direction: Bottom in wave {iv}.
Details: Here we can see a three wave move with a nice subdivision in wave (c). Given the fact wave {iv} was relatively short compared to wave (iv) of one lesser degree, we could still be in wave (a) of {iv}. Upside target at equality of 3 vs. 1 stands at 450$.
CAT Elliott Wave technical analysis – One-hour chart
On the 1H chart, Caterpillar Inc. (CAT) shows a well-defined three-wave correction with a clear subdivision in wave (c). While it seems like wave {iv} was shorter than wave (iv) of one lesser degree, we could still be in the early stages of wave (a) of {iv}. If wave {iv} holds, the upside target for wave 5 stands at 450$, based on the equality of wave 3 vs. wave 1 projections.
This analysis focuses on the current trend structure of Caterpillar Inc., (CAT) utilizing the Elliott Wave Theory on both the daily and 1-hour charts. Below is a breakdown of the stock's position and potential future movements.
Caterpillar Inc. (CAT) Elliott Wave analysis [Video]
Author

Peter Mathers
TradingLounge
Peter Mathers started actively trading in 1982. He began his career at Hoei and Shoin, a Japanese futures trading company.


