|

Carvana Co. (CVNA) Elliott Wave technical analysis [Video]

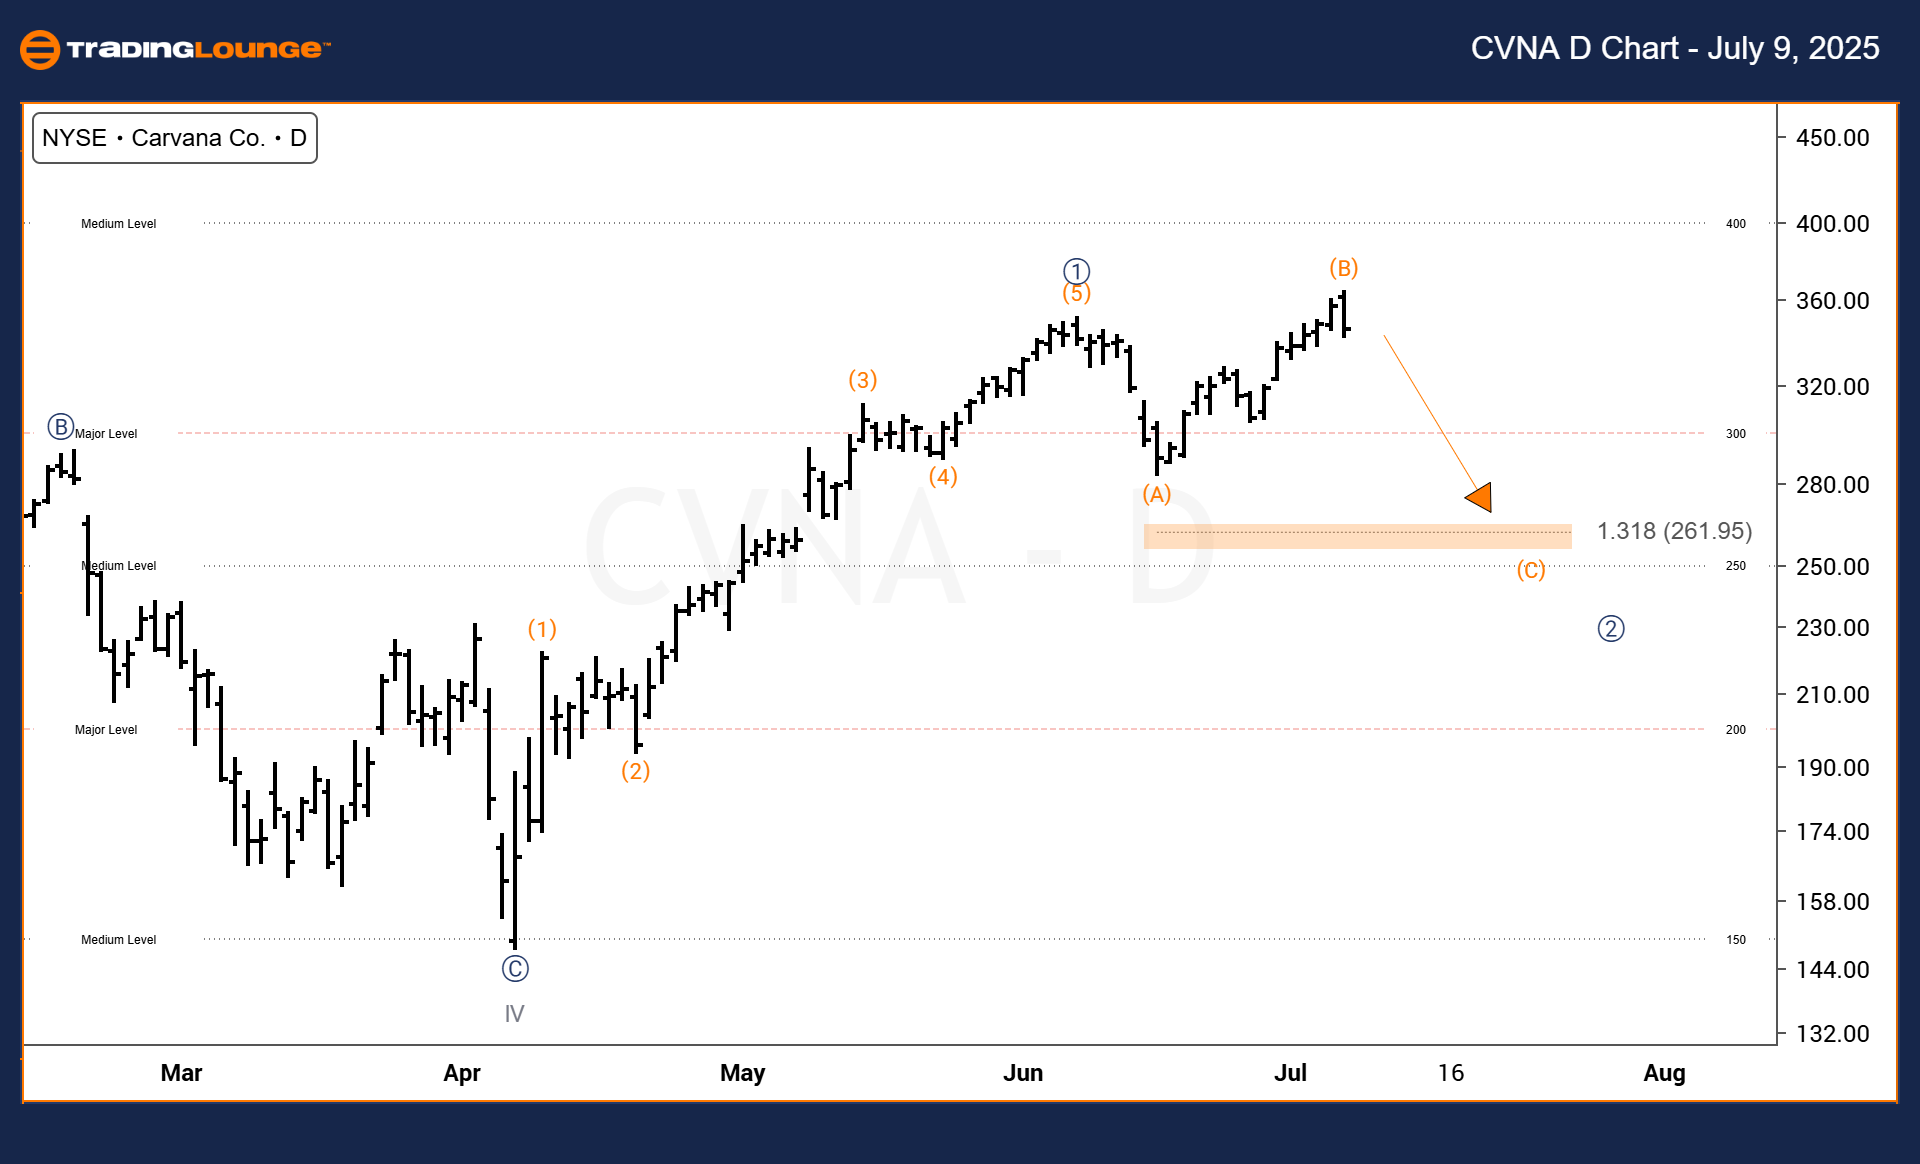
Carvana Co. (CVNA) – Elliott Wave analysis – Daily chart

Technical analysis overview – TradingLounge

Function: Counter Trend.

Mode: Corrective.

Structure: Corrective.

Position: Wave (C) of ②.

Direction: Downward toward Wave (C).

Details: Following a completed 5-wave impulse, a correction toward Wave (C) of ② is in progress.

On the daily timeframe, Carvana Co. (CVNA) has finalized its five-wave impulsive move and is now in a corrective phase. The current movement appears to be forming a flat pattern. Price is likely to find support above the 131.8% Fibonacci retracement from Wave (A) to (B), suggesting the last leg of this corrective sequence is developing.

As Wave (B) finishes, the next expected movement is Wave (C), which will conclude Wave ②. This scenario could offer a short-term bearish opportunity, providing traders with a potential tactical setup during the final stage of the correction.

Chart

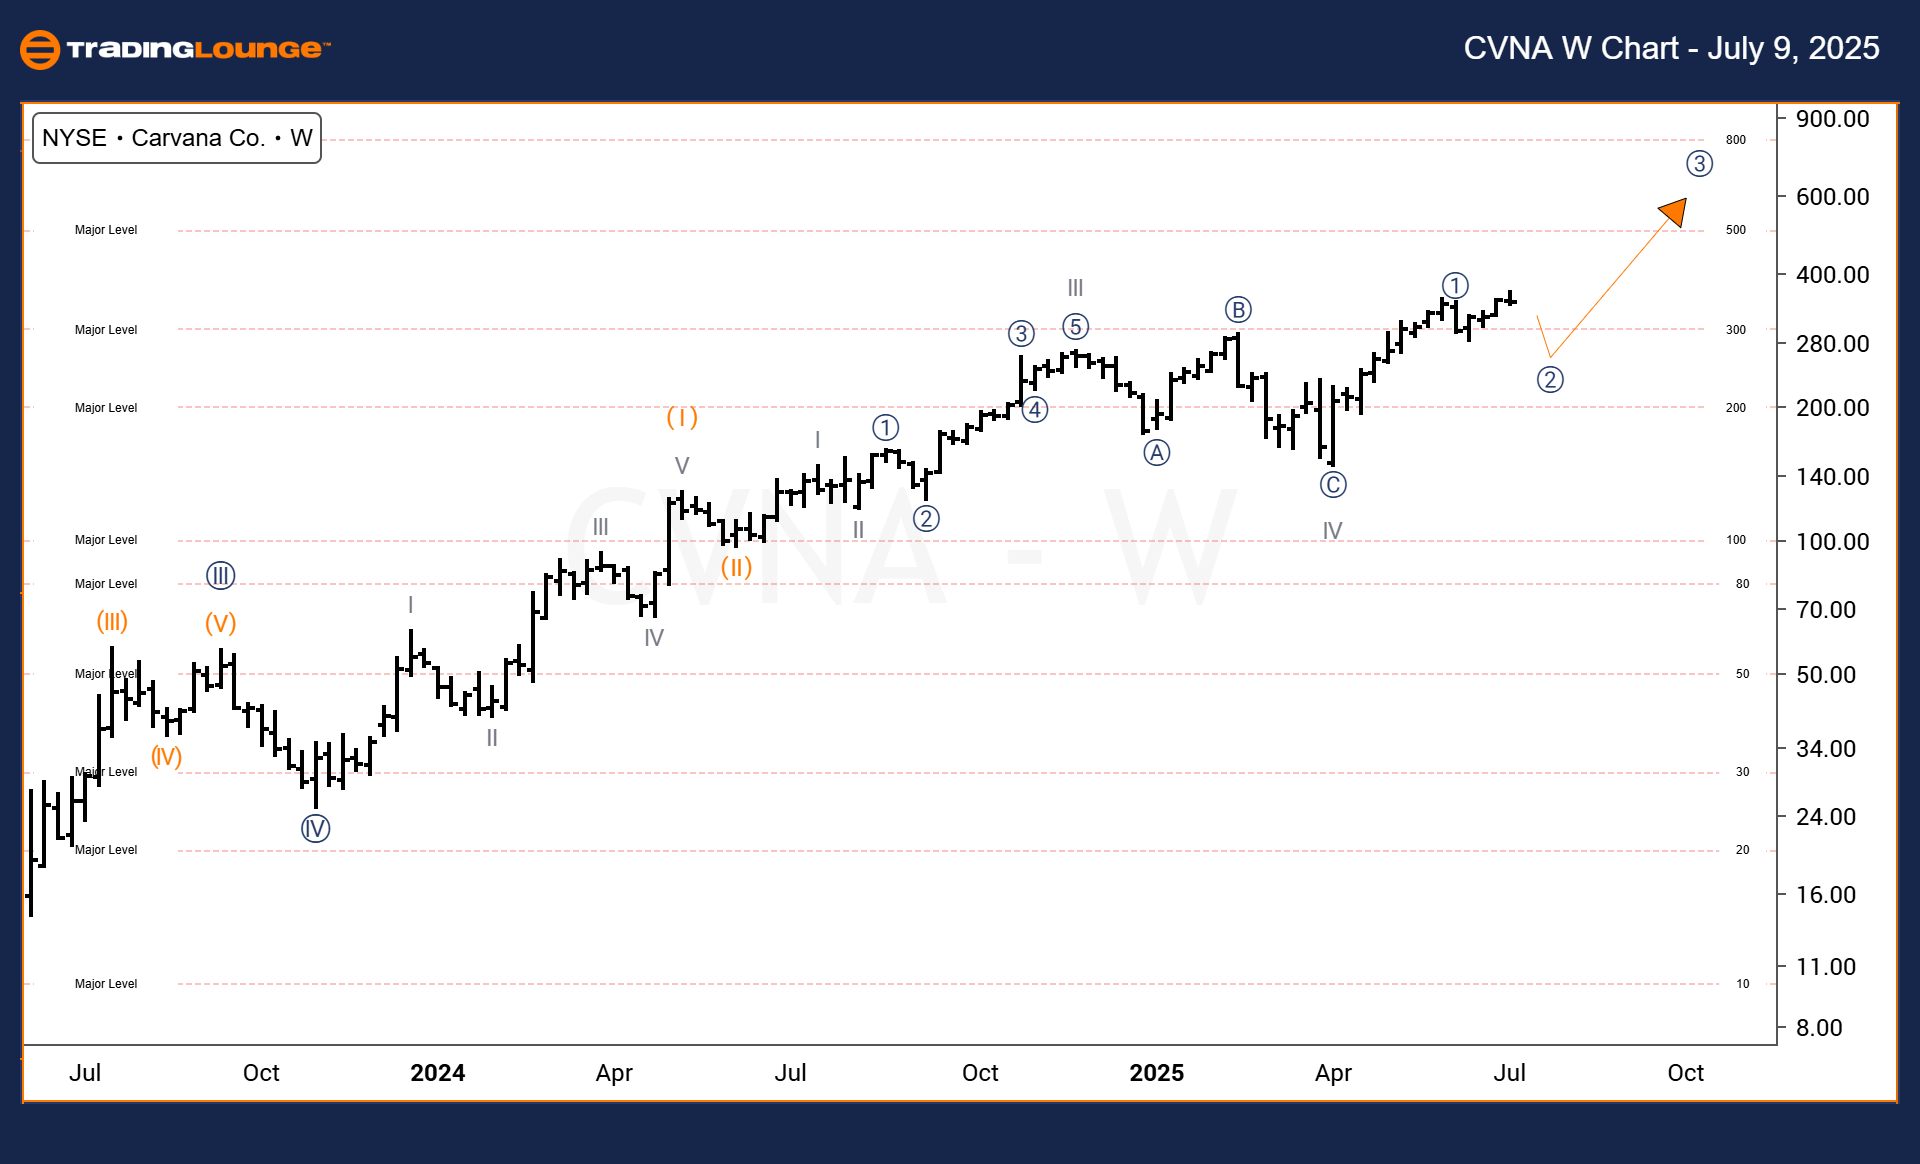
Carvana Co. (CVNA) – Elliott Wave analysis – Weekly chart

Function: Trend.

Mode: Impulsive.

Structure: Impulsive.

Position: Wave ③ of III.

Direction: Upward into Wave ③.

Details: A pullback to Wave ② is anticipated before Wave ③ begins.

On the weekly chart, CVNA remains in a strong upward trend within a broader impulsive structure. The stock is advancing toward Wave ③ of Wave III. However, a retracement to Wave ② is expected before Wave ③ initiates.

Traders should watch for confirmation of Wave ② support and observe key levels. Once confirmed, the next leg up—Wave ③—may offer a long setup aligned with the broader bullish trend.

Chart

Carvana Co. (CVNA) Elliott Wave technical analysis [Video]

Author

Peter Mathers

Peter Mathers

TradingLounge

Peter Mathers started actively trading in 1982. He began his career at Hoei and Shoin, a Japanese futures trading company.

More from Peter Mathers
Share:

Editor's Picks

EUR/USD flirts with daily highs, retargets 1.1900

EUR/USD regains upside traction, returning to the 1.1880 zone and refocusing its attention to the key 1.1900 barrier. The pair’s slight gains comes against the backdrop of a humble decline in the US Dollar as investors continue to assess the latest US CPI readings and the potential Fed’s rate path.

GBP/USD remains well bid around 1.3650

GBP/USD maintains its upside momentum in place, hovering around daily highs near 1.3650 and setting aside part of the recent three-day drop. Cable’s improved sentiment comes on the back of the Greenback’s  irresolute price action, while recent hawkish comments from the BoE’s Pill also collaborate with the uptick.

Gold clings to gains just above $5,000/oz

Gold is reclaiming part of the ground lost on Wednesday’s marked decline, as bargain-hunters keep piling up and lifting prices past the key $5,000 per troy ounce. The precious metal’s move higher is also underpinned by the slight pullback in the US Dollar and declining US Treasury yields across the curve.

Crypto Today: Bitcoin, Ethereum, XRP in choppy price action, weighed down by falling institutional interest 

Bitcoin's upside remains largely constrained amid weak technicals and declining institutional interest. Ethereum trades sideways above $1,900 support with the upside capped below $2,000 amid ETF outflows.

Week ahead – Data blitz, Fed Minutes and RBNZ decision in the spotlight

US GDP and PCE inflation are main highlights, plus the Fed minutes. UK and Japan have busy calendars too with focus on CPI. Flash PMIs for February will also be doing the rounds. RBNZ meets, is unlikely to follow RBA’s hawkish path.

Ripple Price Forecast: XRP potential bottom could be in sight

Ripple edges up above the intraday low of $1.35 at the time of writing on Friday amid mixed price actions across the crypto market. The remittance token failed to hold support at $1.40 the previous day, reflecting risk-off sentiment amid a decline in retail and institutional sentiment.