Carnival Cruise Lines are pushing higher, key resistance levels here

Carnival Corporation (CCL) has staged an impressive move higher since its Liberation Day lows, and it’s been a run that’s hard to ignore from a technical standpoint. From those lows, the stock is now up more than 119%, showing clear momentum and renewed strength on the chart. Despite this strong rebound, it’s important to keep perspective—CCL still remains down more than 54% from its all-time highs, which tells me that while the recovery has been significant, the longer-term technical picture still has work to do.
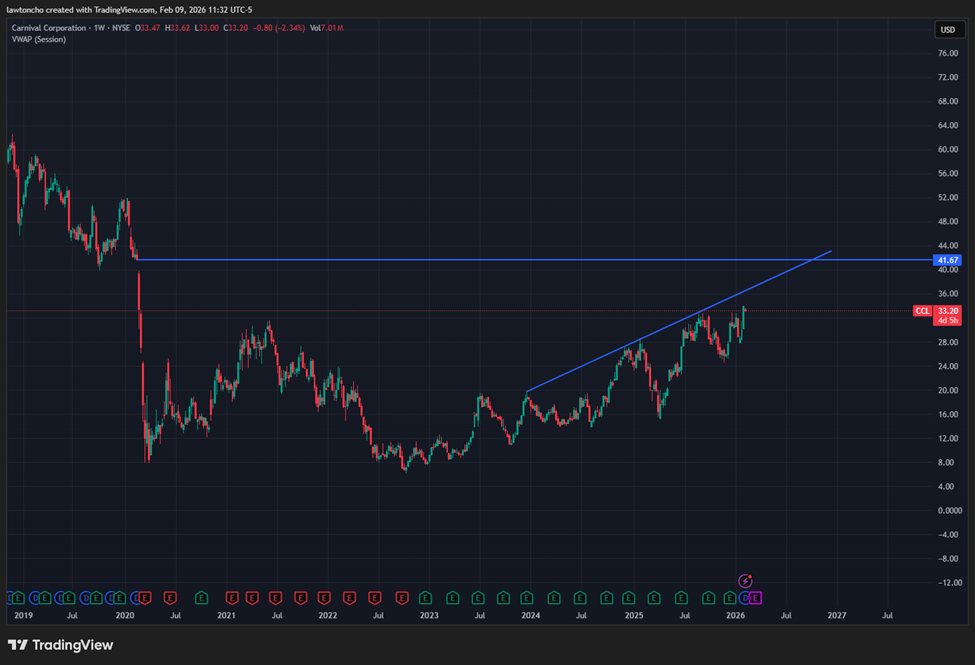
Looking at the chart and focusing strictly on the technicals, I’m identifying several key resistance levels that traders should have on their radar as price continues to push higher. The first area I’m watching closely is an upsloping trendline that has developed on the chart. Based on current price structure, I see that trendline coming into play near the $36 region. If price approaches that level, it would not be surprising to see the stock encounter resistance there, as trendlines like this often act as areas where prior momentum pauses or consolidates.
Beyond that initial level, the next major resistance zone I have marked is the gap fill near $42. This is another technically relevant area that could act as a magnet if momentum continues. However, should price reach that region, I would anticipate the potential for a more meaningful pullback, as gap fills often become inflection points where traders reassess positioning.
From a broader perspective, CCL’s recent move highlights just how strong the recovery has been since its prior lows. The stock’s ability to rally over 119% while still trading well below its historical highs creates a chart that remains technically active, with multiple levels that can guide expectations moving forward. When I look at setups like this, I rely heavily on clearly defined technical levels to help frame both opportunity and risk.
As always, regardless of how strong a chart may look in the near term, I believe it’s critical to utilize proper risk management strategies when trading stocks. Strong moves can continue, but they can also reverse quickly, especially near defined resistance levels. Having a plan in place before entering any trade remains just as important as identifying the technical setup itself.
Author

Lawton Ho
Verified Investing
A marketing expert sharing his journey to mastering the charts.