Canadian Dollar gives lopsided Tuesday performance amid Canadian data drought
- The Canadian Dollar eased back on Tuesday, but the US Dollar fell faster.
- Canada remains data-light until Friday’s GDP print.
- Markets are hunkering down until Friday’s US PCE inflation figures.

The Canadian Dollar (CAD) traded with a broadly softer tone on Tuesday, easing back against the majority of its major currency peers, but still found room to move higher against the US Dollar (USD). The Greenback floundered across the board heading into the midweek, dipping into the red and helping to send USD/CAD into a third straight down day.
Canada remains mostly absent from the economic calendar this week until Friday’s Gross Domestic Product (GDP) update for the second quarter. Annualized Q2 GDP is expected to tick down to 1.6% from 1.7%, but markets are likely to be focused entirely on US Personal Consumption Expenditure - Price Index (PCE), which are due to print in the same release window.
Daily digest market movers
- Markets continue to sell the Greenback into the ground as rate cut expectations hold on the high side.
- CAD continues to struggle to find its own momentum and remains at the mercy of broader market flows.
- The Federal Reserve (Fed) pivoting into a dovish stance remains the talk of the town.
- According to the CME’s FedWatch Tool, rate markets are pricing into over 35% odds of a 50 bps rate trim on September 18, with the remainder expecting a quarter-point cut.
- Rate traders expect a total of 100 bps in cuts by the year’s end.
Canadian Dollar price forecast
Despite the Canadian Dollar’s (CAD) unconfident tone on Tuesday, a broadly weakening US Dollar has sent USD/CAD price action into the gutter, extending a decline below 1.3500 and testing six-month lows near 1.3450. The pair has traded into the red for all but four of the last 17 consecutive trading days, tumbling 3.5% peak-to-trough from early August’s peak bids just shy of 1.3950.
A one-sided bearish plunge in USD/CAD chart action has let bids slump directly through the 200-day Exponential Moving Average (EMA) at 1.3628. Sidelined bulls are running out of room to find a foothold before momentum breaks through the low end of early 2024’s congestion zone between 1.3600 and 1.3400.
USD/CAD daily chart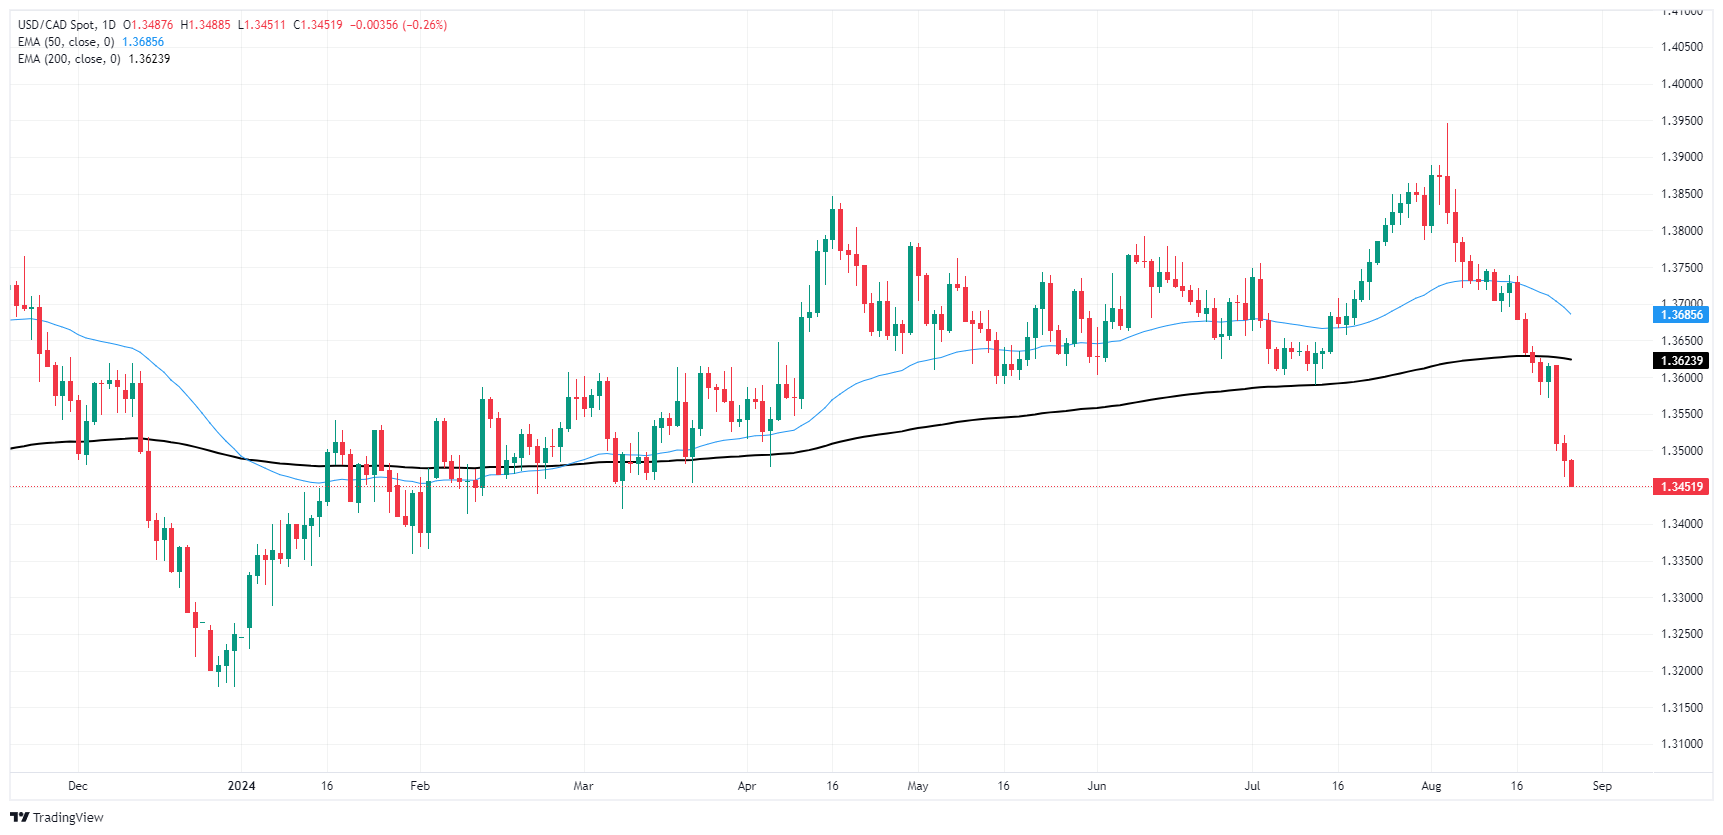
Economic Indicator
Gross Domestic Product Annualized
The Gross Domestic Product (GDP), released by Statistics Canada on a monthly and quarterly basis, is a measure of the total value of all goods and services produced in Canada during a given period. The GDP is considered as the main measure of Canada’s economic activity. The data is expressed at an annualized rate, which means that the rate has been adjusted to reflect the amount GDP would have changed over a year’s time, had it continued to grow at that specific rate. Generally, a high reading is seen as bullish for the Canadian Dollar (CAD), while a low reading is seen as bearish.
Read more.Next release: Fri Aug 30, 2024 12:30
Frequency: Quarterly
Consensus: 1.6%
Previous: 1.7%
Source: Statistics Canada
Author

Joshua Gibson
FXStreet
Joshua joins the FXStreet team as an Economics and Finance double major from Vancouver Island University with twelve years' experience as an independent trader focusing on technical analysis.


