|

CAD/JPY Price Analysis: Plunges for 7-straight days, despite BoC’s rate hike

  • CAD/JPY extends losses for the seventh consecutive day, with minimal decline of 0.07%, trading near weekly low of 104.79.
  • Despite BoC raising rates to 5%, the pair fails to gain momentum, losing 0.99% or 100 pips.
  • Downward trend aims for support at June 7 high of 104.88, potentially leading to 104.00 and June 8 low of 103.70.
  • Bullish continuation requires breaking above resistance at 105.00, with further hurdles at 105.45, 106.11, Kijun-Sen at 106.60, and Tenkan-Sen at 107.09.

As the Asian session begins, the CAD/JPY extends its losses to seven straight days, registering minimal losses of 0.07%. Despite the Bank of Canada (BoC) raising rates by 25 bps to 5% on Wednesday, the CAD/JPY pair failed to gain traction and lost 0.99% or 100 pips. As of writing, the CAD/JPY trades at 104.96, nearby the weekly low of 104.79.

CAD/JPY Price Analysis: Technical outlook

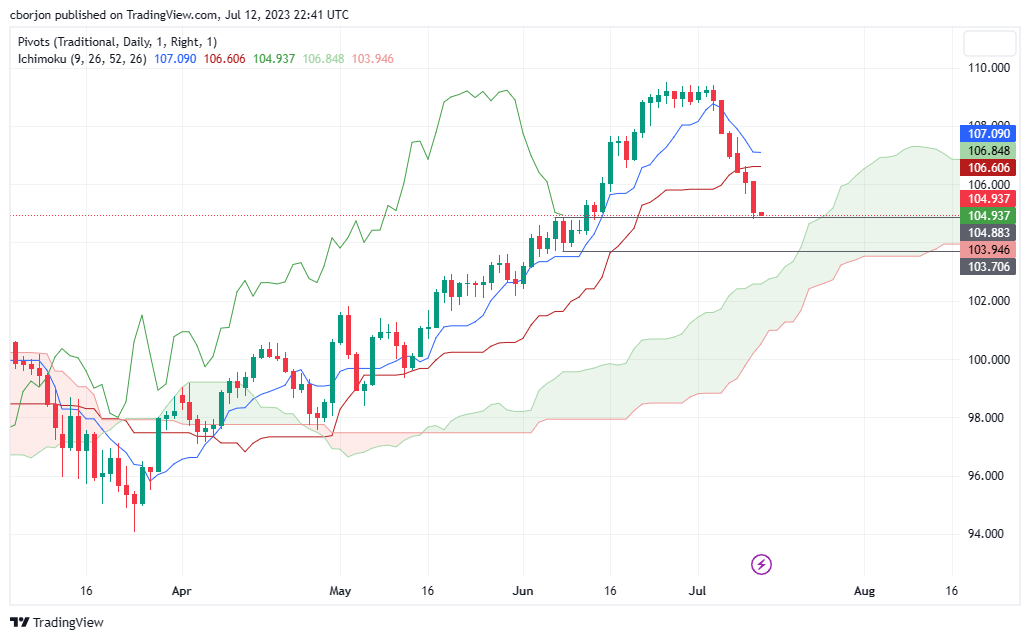
The CAD/JPY daily chart portrays the pair as upward biased, similar to the AUD/JPY pair case published here. Even though the CAD/JPY edged lower, as long as it remains above the Ichimoku Cloudthe uptrend remains in place. But some mixed signals suggest caution is warranted, like prices sliding below the Tenkan-Sen and Kijun-Sen lines and the Chikou Span about to turn bearish can pave the way for further losses.

If CAD/JPY continues to drop, the June 7 daily high of 104.88 will be the first support level to challenge. A breach of the latter will expose the 104.00 mark, followed by the June 8 daily low of 103.70.

Conversely, the CAD/JPY first resistance would be 105.00 for a bullish continuation. Once cleared, the next resistance emerges at the June 13 daily high of 105.45, followed by the July 12 daily high of 106.11. the next resistance level would be the Kijun-Sen line at 106.60 before the Tenkan-Sen at 107.09.

CAD/JPY Price Action – Daily chart

CAD/JPY Daily chart

CAD/JPY

Overview
Today last price104.96
Today Daily Change-1.10
Today Daily Change %-1.04
Today daily open106.06
 
Trends
Daily SMA20107.95
Daily SMA50104.61
Daily SMA100101.59
Daily SMA200101.63
 
Levels
Previous Daily High106.62
Previous Daily Low105.63
Previous Weekly High109.41
Previous Weekly Low106.87
Previous Monthly High109.51
Previous Monthly Low102.41
Daily Fibonacci 38.2%106.01
Daily Fibonacci 61.8%106.24
Daily Pivot Point S1105.59
Daily Pivot Point S2105.11
Daily Pivot Point S3104.59
Daily Pivot Point R1106.58
Daily Pivot Point R2107.1
Daily Pivot Point R3107.57

Author

Christian Borjon Valencia

Christian Borjon began his career as a retail trader in 2010, mainly focused on technical analysis and strategies around it. He started as a swing trader, as he used to work in another industry unrelated to the financial markets.

More from Christian Borjon Valencia
Share:

Markets move fast. We move first.

Orange Juice Newsletter brings you expert driven insights - not headlines. Every day on your inbox.

By subscribing you agree to our Terms and conditions.

Editor's Picks

EUR/USD flatlines below 1.1800 ahead of Fed Minutes

EUR/USD struggles to find direction and continues to move sideways below 1.1800 for the second consecutive day on Tuesday as markets remain in holiday mood. Later in the American session, the Federal Reserve will publish the minutes of the December policy meeting.

GBP/USD retreats to 1.3500 area following earlier climb

GBP/USD loses its traction and trades flat on the day near 1.3500 after rising to the 1.3530 area early Tuesday. Trading conditions remain thin ahead of the New Year holiday, limiting the pair's volatility. The Fed will publish December meeting minutes in the late American session.

Gold rebounds toward $4,400 following sharp correction

Gold gathers recovery momentum and advances toward $4,400 on Tuesday after losing more than 4% on Monday. Increased margin requirements on gold and silver futures by the Chicago Mercantile Exchange Group, one of the world’s largest trading floors for commodities, prompted widespread profit-taking and portfolio rebalancing.

Tron steadies as Justin Sun invests $18 million in Tron Inc.

Tron (TRX) trades above $0.2800 at press time on Monday, hovering below the 50-day Exponential Moving Average (EMA) at $0.2859.

Economic outlook 2026-2027 in advanced countries: Solidity test

After a year marked by global economic resilience and ending on a note of optimism, 2026 looks promising and could be a year of solid economic performance. In our baseline scenario, we expect most of the supportive factors at work in 2025 to continue to play a role in 2026.

Crypto market outlook for 2026

Year 2025 was volatile, as crypto often is.  Among positive catalysts were favourable regulatory changes in the U.S., rise of Digital Asset Treasuries (DAT), adoption of AI and tokenization of Real-World-Assets (RWA).