CAC 40 Index Elliott Wave technical analysis [Video]
![CAC 40 Index Elliott Wave technical analysis [Video]](https://editorial.fxsstatic.com/images/i/supermicro-02_XtraLarge.jpg)
CAC 40 (France) Wave technical analysis
Function: Bullish Trend.
Mode: Impulsive.
Structure: Orange Wave 3.
Position: Navy Blue Wave 1.
Direction next higher degrees: Orange Wave 3 (started).
Details: Orange Wave 2 is likely completed. Orange Wave 3 is now active.
Wave cancel invalidation level: 6771.
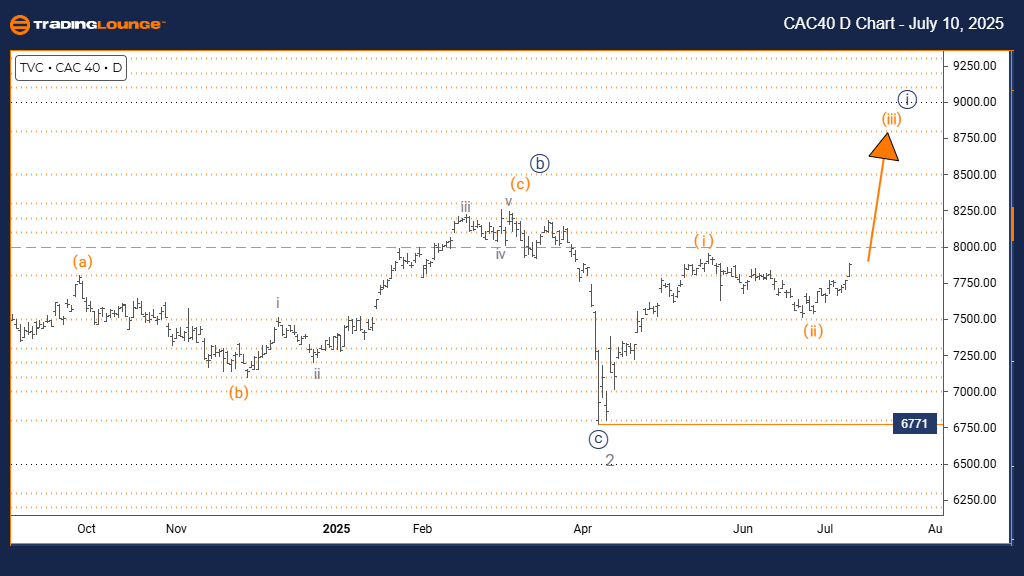
Daily chart overview
The daily analysis of France’s CAC 40 Index presents a bullish market condition, with price action showing clear impulsive traits consistent with Elliott Wave theory. The index appears to be progressing through Orange Wave 3, a typically powerful wave in Elliott sequences, within the broader structure of Navy Blue Wave 1. This implies early stages of a potentially extended upward move.
Technical indicators confirm that Orange Wave 2 has completed. The momentum seen in Orange Wave 3 suggests strengthening bullish sentiment. A key level to monitor is 6771, the invalidation point; a break below this would challenge the current wave count. The ongoing impulsive pattern reflects solid buying pressure and market strength, with the structure hinting at the beginning of a sustained uptrend if the wave sequence holds.
This setup offers a favorable risk-to-reward opportunity as long as the price remains above the critical support level. Traders should track wave development to confirm continued bullish movement and manage positions accordingly.
CAC 40 (France) Wave technical analysis
Function: Trend.
Mode: Impulsive.
Structure: Navy Blue Wave 1.
Position: Gray Wave 3.
Direction next lower degrees: Navy Blue Wave 2.
Details: Gray Wave 2 appears complete. Navy Blue Wave 1 of Gray Wave 3 is now underway.
Wave cancel invalidation level: 6771.
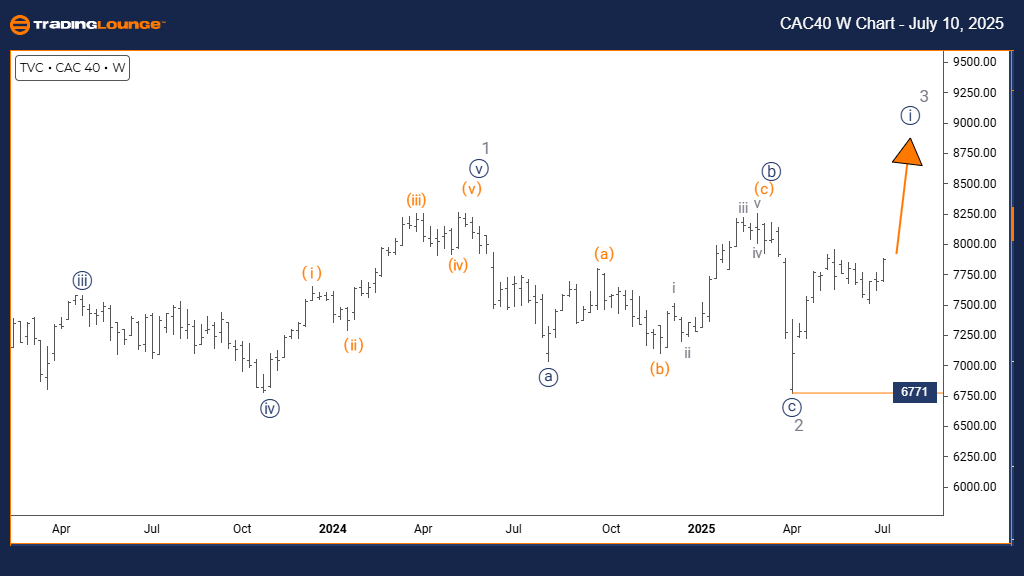
Weekly Chart Insight
The weekly Elliott Wave review of the CAC 40 suggests a developing uptrend. The index is currently forming Navy Blue Wave 1 within Gray Wave 3—indicating a potentially powerful bullish phase. Following the completion of Gray Wave 2, the price is now moving through an impulsive rally that is expected to continue until Navy Blue Wave 1 completes and Navy Blue Wave 2 begins as a corrective retracement.
This wave alignment underlines a solid upward structure supported by strong momentum. As long as the price stays above the key invalidation level of 6771, the bullish view remains intact. This level will be crucial for traders to watch as it anchors the structural integrity of the current wave pattern.
The weekly timeframe amplifies the significance of the analysis by capturing broader sentiment and institutional activity. Traders should anticipate the potential for extended gains while preparing for a corrective phase as part of the overall wave cycle.
CAC 40 (France) Wave technical analysis [Video]
Author

Peter Mathers
TradingLounge
Peter Mathers started actively trading in 1982. He began his career at Hoei and Shoin, a Japanese futures trading company.


