CAC 40 (France) Index Elliott Wave technical analysis [Video]
![CAC 40 (France) Index Elliott Wave technical analysis [Video]](https://editorial.fxsstatic.com/images/i/Equity-Index_CAC40-2_XtraLarge.jpg)
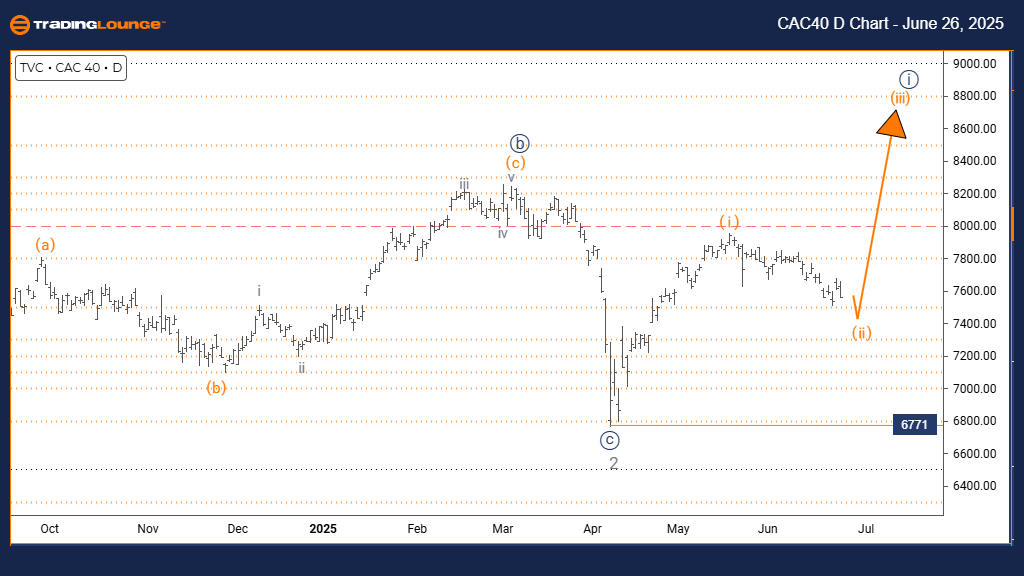
CAC 40 (France) Wave technical review
Function: Counter Trend.
Mode: Corrective.
Structure: Orange Wave 2.
Position: Navy Blue Wave 1.
Direction next higher degrees: Orange Wave 3.
Details: Orange Wave 1 appears complete; Orange Wave 2 is underway.
Wave Cancel/Invalidation Level: 6771.
The CAC 40 daily chart Elliott Wave analysis outlines a counter-trend movement characterized by a corrective structure. The current wave, Orange Wave 2, is developing within a broader trend represented by Navy Blue Wave 1. This setup signals a normal retracement before a potential continuation in the primary upward direction.
The transition from Orange Wave 1 to Orange Wave 2 marks a typical corrective phase, often retracing a portion of the previous upward movement. Once Orange Wave 2 concludes, the chart anticipates Orange Wave 3, which may resume the broader trend.
At present, the CAC 40 is within Orange Wave 2, likely indicating range-bound movement or moderate pullbacks. This is confirmed by the structure’s position within Navy Blue Wave 1, which maintains the corrective tone.
Traders should closely observe the completion signals of Orange Wave 2, as the next potential move in Orange Wave 3 may follow. The key invalidation level remains at 6771; a drop below this level would require a fresh interpretation of the wave setup.
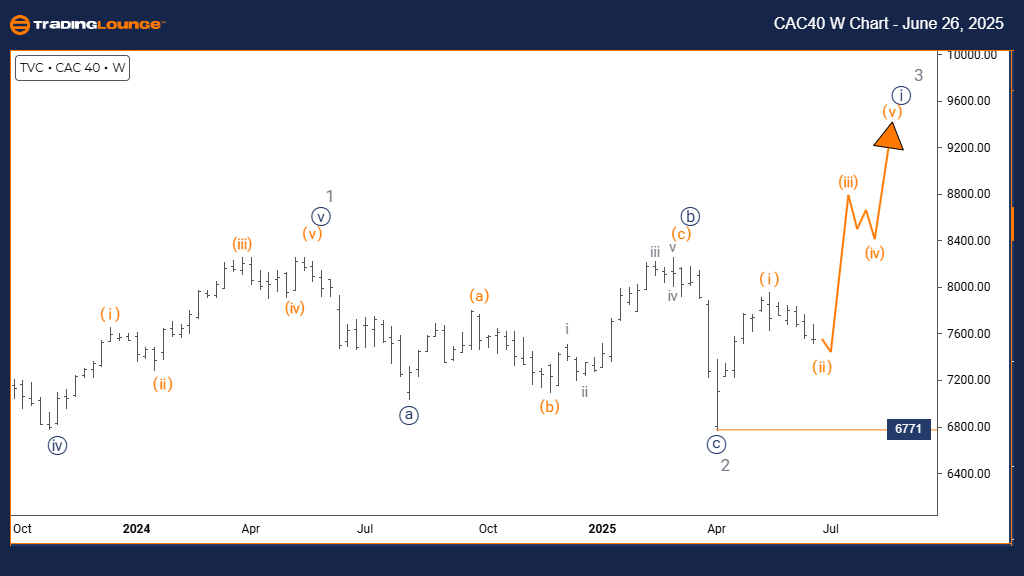
CAC 40 (France) Wave technical review
Function: Bullish Trend.
Mode: Impulsive.
Structure: Navy Blue Wave 1.
Position: Gray Wave 3.
Direction next lower degrees: Navy Blue Wave 2.
Details: Gray Wave 2 appears complete; Navy Blue Wave 1 of 3 is active.
Wave cancel/invalidation level: 6771.
The CAC 40 weekly Elliott Wave chart shows a bullish trend with impulsive momentum. The current wave, Navy Blue Wave 1, is part of the broader Gray Wave 3, indicating the start of a potentially strong upward sequence.
With Gray Wave 2 completed, the emergence of Navy Blue Wave 1 suggests the early phase of a high-momentum third wave. The next wave, Navy Blue Wave 2, is expected to follow, offering a corrective move once the current impulse wave ends.
The invalidation level is set at 6771. A decline below this point would negate the current wave count. If held, it supports continued bullish price action.
With Navy Blue Wave 1 developing after the correction of Gray Wave 2, the CAC 40 may see robust growth driven by institutional buying and wave momentum, continuing within Gray Wave 3.
CAC 40 (France) Wave technical review [Video]
Author

Peter Mathers
TradingLounge
Peter Mathers started actively trading in 1982. He began his career at Hoei and Shoin, a Japanese futures trading company.


