CAC 40 Elliott Wave technical analysis [Video]
![CAC 40 Elliott Wave technical analysis [Video]](https://editorial.fxstreet.com/images/TechnicalAnalysis/ChartPatterns/Candlesticks/foreign-exchange-market-chart-24348895_XtraLarge.jpg)
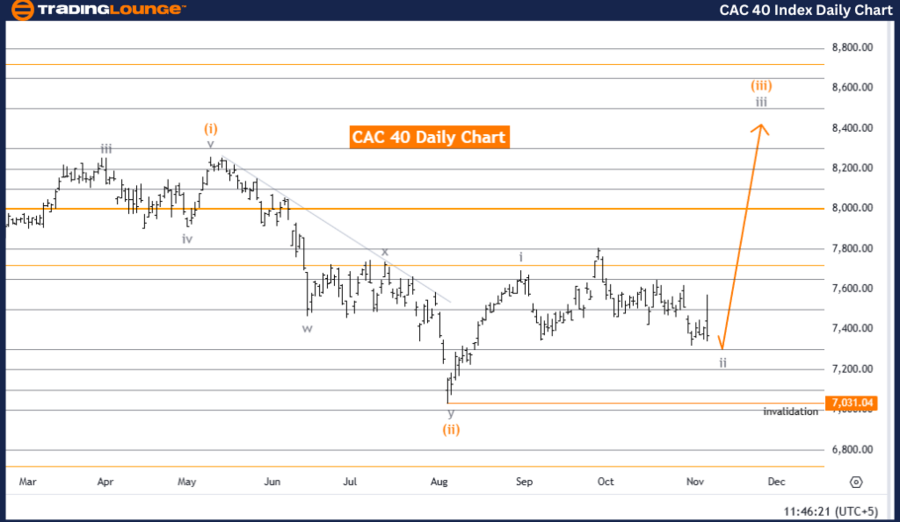
CAC 40 (France) Elliott Wave Analysis Trading Lounge day chart.
CAC 40 Elliott Wave technical analysis
-
Function: Counter Trend.
-
Mode: Corrective.
-
Structure: Gray Wave 2.
-
Position: Orange Wave 3.
-
Next higher degree direction: Gray Wave 3.
-
Details: Gray Wave 1 appears completed, with Gray Wave 2 of Orange Wave 3 currently active.
-
Wave cancellation level: 7,031.04.
The CAC 40 day chart Elliott Wave analysis indicates a counter-trend setup in corrective mode, focusing on gray wave 2. Positioned within the larger structure of orange wave 3, the analysis suggests that gray wave 1 has completed, with gray wave 2 now unfolding within orange wave 3. This corrective phase in gray wave 2 suggests a short-term reversal against the main trend, possibly signaling a pullback or consolidation before orange wave 3 resumes its upward trajectory.
With the invalidation level set at 7,031.04, this point acts as a critical threshold for the current wave structure. If prices stay above this level, the corrective movement of gray wave 2 remains intact, indicating a likely return to an upward trend within the broader context of gray wave 3. Conversely, a drop below this level would invalidate the current wave analysis, potentially signaling a shift away from the current counter-trend view.
The positioning of gray wave 2 within orange wave 3 underscores a corrective phase within the overall trend. With gray wave 1 completed, the corrective nature of gray wave 2 might present opportunities for reversal before a potential continuation of the primary trend. Traders and analysts watching the CAC 40 may consider this phase as an opportunity for a temporary pullback, with close attention to the 7,031.04 invalidation level to ensure adherence to the wave structure.
In summary, the CAC 40 day chart Elliott Wave analysis signals a counter-trend corrective phase with gray wave 2 now active. Positioned within orange wave 3, this analysis suggests potential consolidation or pullback before the primary trend resumes. The 7,031.04 level is a key threshold for maintaining the current wave structure, and holding above this level would mark the end of the corrective phase.
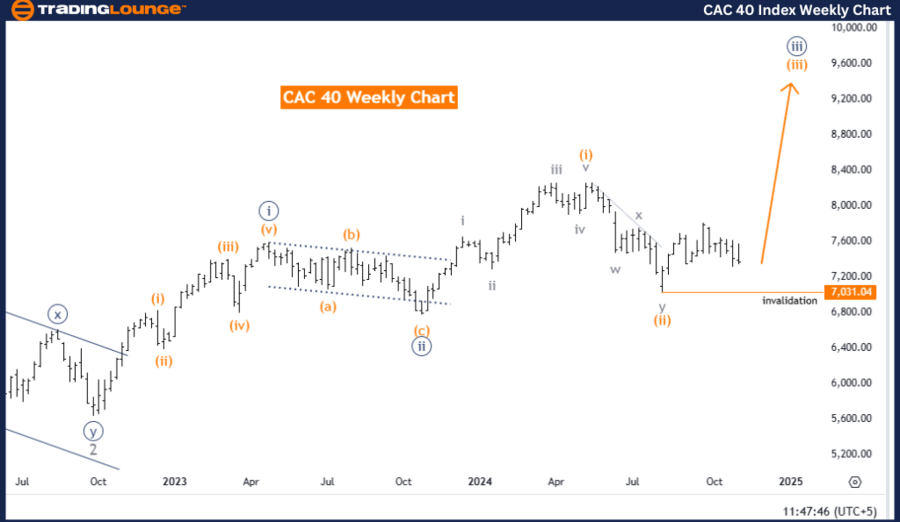
CAC 40 (France) Elliott Wave Analysis Trading Lounge weekly chart
CAC 40 Elliott Wave technical analysis
-
Function: Bullish Trend.
-
Mode: Impulsive.
-
Structure: Orange Wave 3.
-
Position: Navy Blue Wave 3.
-
Next higher degree direction: Orange Wave 3 (started).
-
Details: Orange Wave 2 appears completed, with Orange Wave 3 now active.
-
Wave cancellation level: 7,031.04.
The CAC 40 weekly chart Elliott Wave analysis indicates a bullish trend in an impulsive mode, focusing on the progression of orange wave 3. Within this structure, navy blue wave 3 is in progress, aligning with the recently started larger orange wave 3. This pattern suggests that orange wave 2 has completed, and the CAC 40 index is now entering an upward phase within orange wave 3.
The development of orange wave 3 signals a continuation of the primary bullish trend, reflecting sustained buying momentum in the market. With orange wave 2 recently completed, orange wave 3 is expected to further extend the overall upward movement, reinforcing a positive outlook for the CAC 40 index within the broader wave structure.
The wave invalidation level is set at 7,031.04, marking a critical support level for the current bullish configuration. If prices remain above this level, the analysis favors a continuation of the upward trend, validating the ongoing progression of orange wave 3. However, a drop below this level would invalidate the current wave structure, possibly altering the bullish outlook and indicating a need for reassessment.
In summary, the CAC 40 weekly chart analysis reflects a bullish trend in an impulsive wave structure, led by orange wave 3. Following the completion of orange wave 2, the chart suggests a strong upward movement within orange wave 3, consistent with the broader bullish pattern. The 7,031.04 level serves as a vital threshold, supporting the current trend as long as prices remain above it. This bullish configuration suggests continued growth potential for the CAC 40 index within the ongoing Elliott Wave framework.
CAC 40 Elliott Wave technical analysis [Video]
Author

Peter Mathers
TradingLounge
Peter Mathers started actively trading in 1982. He began his career at Hoei and Shoin, a Japanese futures trading company.


