|

BXB Elliott Wave technical forecast [Video]

BRAMBLES LIMITED - BXB Elliott Wave Technical Analysis TradingLounge.

Greetings, Our Elliott Wave analysis today updates the Australian Stock Exchange (ASX) with BRAMBLES LIMITED - BXB. We see ASX:BXB could be about to push higher with a ((3))-navy wave.

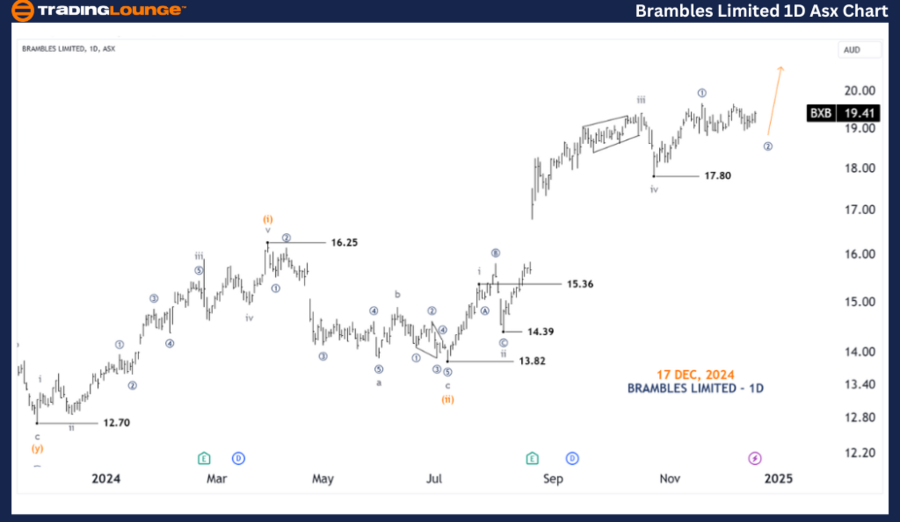
Brambles Limited - BXB 1D chart (semilog scale) analysis

Function: Major trend (Minuette degree, orange).

Mode: Motive.

Structure: Impulse.

Position: Wave ((2))-navy of Wave v-grey.

Details: The v-grey wave may be extending, and it is close to completing the ((2))-navy wave itself, after which the ((3))-navy wave may push higher.

Invalidation point: 17.80.
Chart

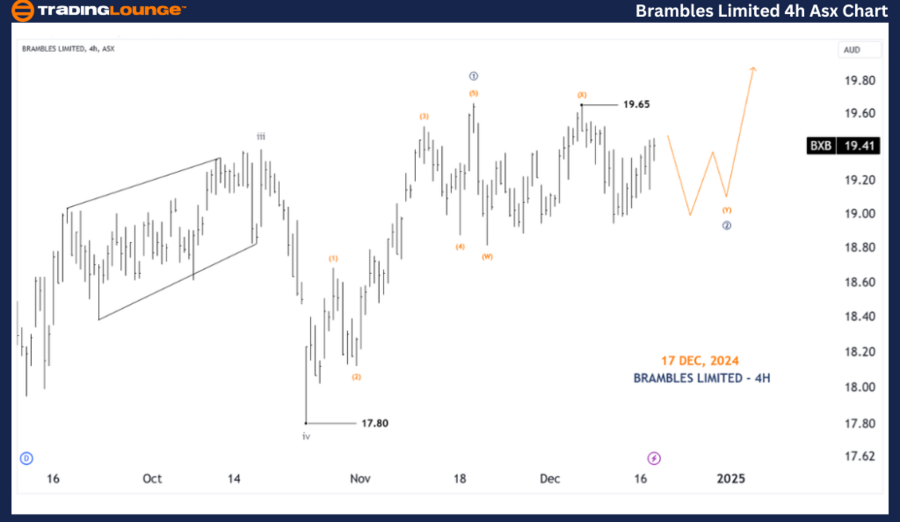
Brambles Limited - BXB four-hour chart analysis

Function: Major trend (Minor degree, grey).

Mode: Motive.

Structure: Impulse.

Position: Wave (y)-orange of Wave ((2))-navy.

Details: Wave ((1))-navy of the v-grey wave has completed, and wave ((2))-navy is pushing a little lower, it is probably developing as a complex Double Three and needs a little more time to complete its entire wave (y)-orange. Then wave ((3))-navy will return to push higher. Or when price breaks strongly above the 19.65 high, it will also suggest wave ((3))-navy is unfolding.

Invalidation point: 17.80.

Cofirmation point: 19.65.
Chart

Conclusion:

Our analysis, forecast of contextual trends, and short-term outlook for BRAMBLES LIMITED - BXB aim to provide readers with insights into the current market trends and how to capitalize on them effectively. We offer specific price points that act as validation or invalidation signals for our wave count, enhancing the confidence in our perspective. By combining these factors, we strive to offer readers the most objective and professional perspective on market trends.

Technical analyst: Hua (Shane) Cuong, CEWA-M (Master’s Designation).

Brambles Limited - BXB 1D chart (semilog scale) analysis [Video]

Author

Peter Mathers

Peter Mathers

TradingLounge

Peter Mathers started actively trading in 1982. He began his career at Hoei and Shoin, a Japanese futures trading company.


More from Peter Mathers
Share:

Editor's Picks

AUD/USD remains above 0.7200 after China's trade data

AUD/USD sits above 0.7200 in the Asian session on Tuesday, near its highest level since May 14. The US Dollar stays under pressure as a rallying Japanese Yen outweighs support from hawkish Fed bets and geopolitical tensions. This, along with firming expectations for another RBA rate hike later this month, acts as a tailwind for the Aussie. However, mixed China trade balance data keep the pair restricted.

USD/JPY stabilizes at around 154.00 as markets assess BoJ outlook

USD/JPY fluctuates at around 154.00 in the American session on Tuesday after rebounding from the six-month low it touched below 153.00 earlier in the day. Nevertheless, the upside attempts resemble technical corrections for now as Japan's upbeat wage growth data and Q2 GDP revision cement bets on a BoJ rate hike next week and continue to support the Japanese Yen.

Gold holds around $4,400, but for how long?
Gold (XAU/USD) remains on the back foot during American trading hours on Tuesday, even as the US Dollar (USD) remains on the defensive. Rising Oil prices and expectations of a Federal Reserve (Fed) rate hike weigh on the precious metal. At the time of writing, XAU/USD trades around $4,400 after reaching an intraday high near $4,443.
XRP ticks up as bullish derivatives, EMA support signal breakout
Ripple (XRP) is grinding upward and getting closer to a short-term breakout above $1.40 on Tuesday. This uptick follows the remittance token's defense of support at $1.38, after a short-lived attempt to breach selling pressure at $1.50 last week.
Europe in focus: September 2026
Six major net contributors demanded substantial cuts to the European Commission’s proposed 2028–2034 EU budget. Germany, Denmark, the Netherlands, Austria, Finland and Sweden issued a joint position on 27 August calling for the nearly €2 trillion proposal to be reduced by several hundred billion euros and rejecting additional common EU borrowing.
Diesel’s record $100 warning: The oil shock hiding in plain sight

The Oil market may look calmer than it did a few months ago, but diesel is sending a very different message. The US diesel crack spread, the premium of ultra-low sulphur diesel futures over WTI, recently surged above $100 per barrel for the first time, reaching an intraday record of just over $102.00.