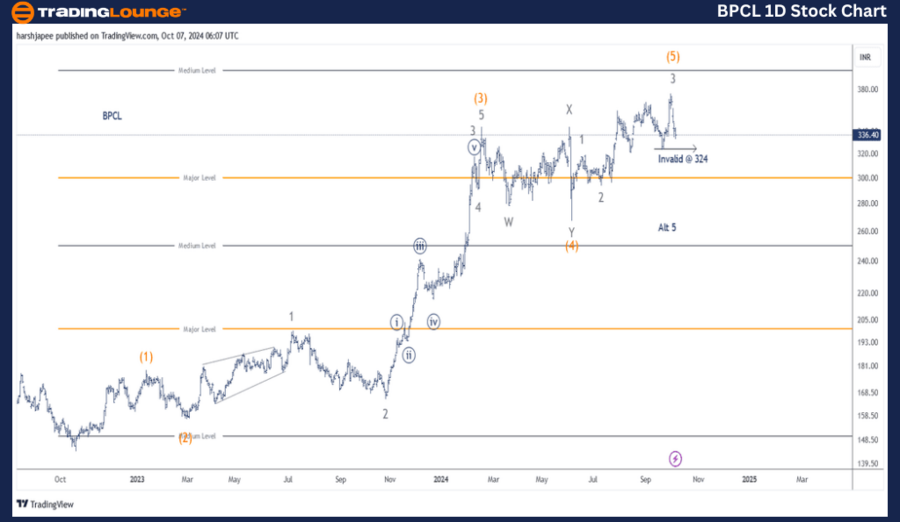
BPCL – BPCL (1D chart) Elliott Wave technical analysis
Function: Larger Degree Trend Higher (Intermediate Degree Orange).
Mode: Motive.
Structure: Impulse.
Position: Minor Wave 3.
Details: Minor Wav 3 Grey progressing higher within Intermediate Wave (5) Orange against 324. Alternatively, Minor Wave 5 Grey is complete and the stock has turned lower. Long traders please exercise caution.
Invalidation point: 324.
BPCL Daily Chart Technical Analysis and potential Elliott Wave Counts
BPCL daily chart is indicating five waves potentially complete between 144 and 380 levels at the Intermediate level. A break below 324 will confirm a major top is in place and the stock is in for a deeper correction lower.
The stock had bottomed around 144 mark in October 2022 and since then Intermediate Waves (1) though (5) Orange look complete through 380 high, which was registered on September 30, 2024. Please note, Minor Wave 3 Grey within Intermediate Wave (5) was extended.
Intermediate Wave (4) Orange completed around 269 on June 04, 2024 along with majority stocks. If the above holds well, high probability remains for Intermediate Wave (5) to have completed around 380 mark. Bears are looking poised to break below 324 near term.
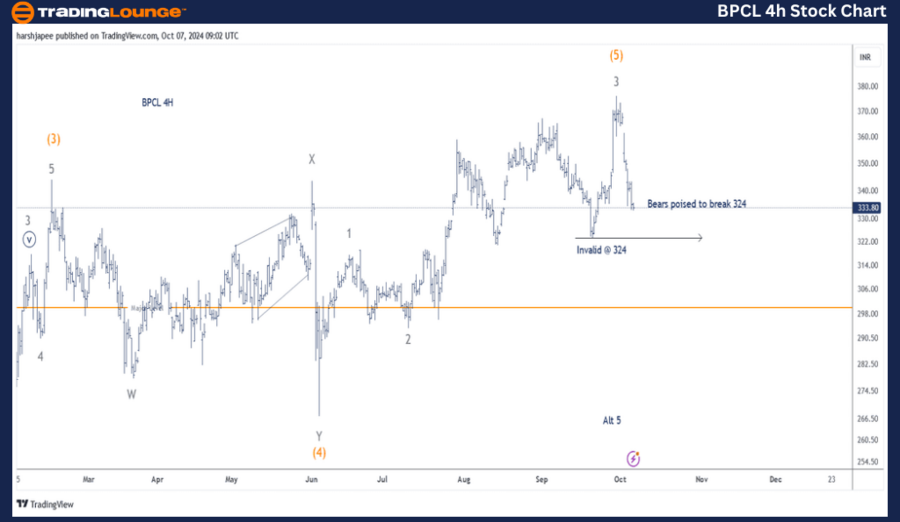
BPCL – BPCL (4H chart) Elliott Wave technical analysis
Function: Larger Degree Trend Higher (Intermediate Degree Orange).
Mode: Motive.
Structure: Impulse.
Position: Minor Wave 3.
Details: Minor Wav 3 Grey progressing higher within Intermediate Wave (5) Orange against 324. Alternatively, Minor Wave 3 terminated around 360, Wave 4 Grey around 324 and Minor Wave 5 Grey is complete around 280 and the stock has turned lower. Long traders please exercise caution.
Invalidation point: 324
BPCL 4H Chart Technical Analysis and potential Elliott Wave Counts.
BPCL 4H chart highlights the sub waves since Intermediate Wave (3) Orange. Please note that Wave (4) Orange was a combination W-X-Y, while Wave (5) is either complete or just one leg away from terminating. Prepare for a potential deeper correction ahead.
Conclusion:
BPCL has either terminated Intermediate Wave (5) Orange around 380 or is close to completing soon. Please watch for a break below 324 for a bearish reversal confirmation.
Elliott Wave analyst: Harsh Japee.
BPCL four-hour chart technical analysis and potential Elliott Wave counts [Video]
As with any investment opportunity there is a risk of making losses on investments that Trading Lounge expresses opinions on.
Historical results are no guarantee of future returns. Some investments are inherently riskier than others. At worst, you could lose your entire investment. TradingLounge™ uses a range of technical analysis tools, software and basic fundamental analysis as well as economic forecasts aimed at minimizing the potential for loss.
The advice we provide through our TradingLounge™ websites and our TradingLounge™ Membership has been prepared without considering your objectives, financial situation or needs. Reliance on such advice, information or data is at your own risk. The decision to trade and the method of trading is for you alone to decide. This information is of a general nature only, so you should, before acting upon any of the information or advice provided by us, consider the appropriateness of the advice considering your own objectives, financial situation or needs. Therefore, you should consult your financial advisor or accountant to determine whether trading in securities and derivatives products is appropriate for you considering your financial circumstances.
Recommended content
Editors’ Picks

EUR/USD strengthens above 1.1600 on risk-on mood
The EUR/USD pair edges higher to around 1.1615 during the early European session on Wednesday. The improved risk sentiment provides some support to the Euro against the Greenback. Traders will take more cues from the Federal Reserve’s Chair Jerome Powell testifies later on Wednesday.

GBP/USD holds gains above 1.3600 due to improved risk appetite
GBP/USD extends its winning streak for the third successive session, trading around 1.3620 during the Asian hours on Wednesday. The pair is hovering around 1.3648, the highest since February 2022, which was recorded on Tuesday. The risk-sensitive GBP/USD pair receives support from the improved risk appetite amid easing tensions in the Middle East.

Gold price struggles to lure buyers as easing Middle East tensions offsets weaker USD
Gold price edges higher as Fed rate cut bets keep the USD bulls on the defensive. Doubts over the durability of the Israel-Iran ceasefire also support the commodity. Traders look forward to this week’s important US macro data for a fresh impetus.

Bitcoin, Ethereum and Ripple eye key breakouts
Bitcoin price continued to trade in green on Wednesday, having risen 5% over the previous two days. Ethereum and Ripple followed BTC’s footsteps and rallied, approaching their key resistance levels, where a breakout would suggest further upside moves.

Could Iran block the Strait of Hormuz? Why Oil is on edge after US strikes
As the Israel-Iran conflict reaches new heights, an old threat is coming back to haunt the markets: that of the closure of the Strait of Hormuz. This narrow arm of the sea in the Persian Gulf, wedged between Iran to the north and the United Arab Emirates and Oman to the south, is much more than a simple sea passage.

The Best brokers to trade EUR/USD
SPONSORED Discover the top brokers for trading EUR/USD in 2025. Our list features brokers with competitive spreads, fast execution, and powerful platforms. Whether you're a beginner or an expert, find the right partner to navigate the dynamic Forex market.