Blue Owl Capital (OWL) chart reveals ominous pattern despite technical flaw

Blue Owl Capital Inc. (OWL), an alternative asset management firm specializing in direct lending and credit strategies, finds itself in a precarious technical position that's caught the attention of chart watchers. Trading at $13.77 after a 5.81% decline, the stock has traced out what appears to be a Head and Shoulders pattern—but there's a twist that makes this setup even more concerning than the textbook version.
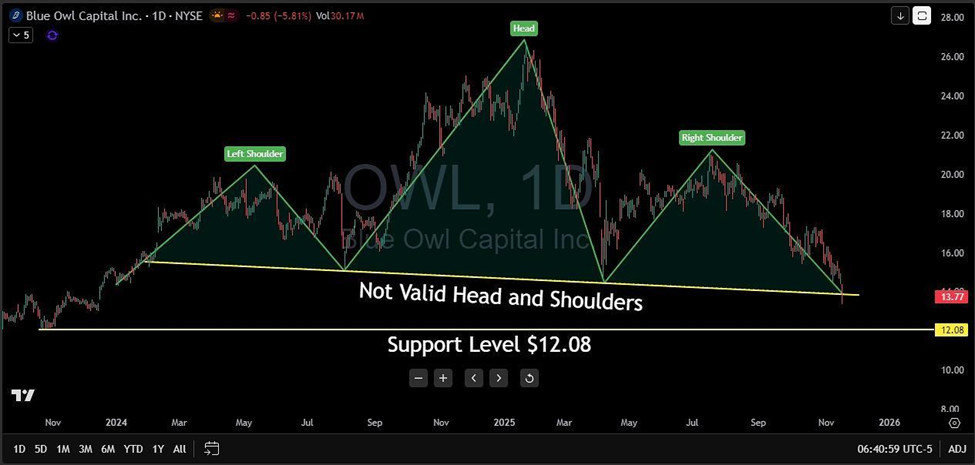
Let's break down what makes this situation so intriguing. From late 2023 through mid-2024, OWL rode a beautiful ascending trendline higher, eventually forming what looks like a classic Head and Shoulders top. You can see the Left Shoulder peaking around $21 in early 2024, followed by the Head reaching approximately $28 by late 2024, and then the Right Shoulder forming around $21-22 in mid-2025.
But then, a twist emerged that changes everything. The neckline—that line connecting the lows between these peaks—slopes downward rather than upward. In traditional technical analysis, a valid Head and Shoulders pattern requires an up-sloping or at minimum a horizontal neckline. This downward-sloping neckline technically invalidates the pattern as a classic reversal formation.
So why does this matter? Counterintuitively, this "flaw" doesn't make the pattern less bearish—it potentially makes it more so. The downward-sloping neckline reveals persistent selling pressure even during the rally attempts, suggesting underlying weakness that never allowed proper consolidation. Think of it as buyers who couldn't even establish a stable base between peaks getting weaker with each attempt.
The measured move calculation from this formation is what should really grab your attention. Using the distance from the Head to the neckline and projecting it downward from the breakdown point, the target comes in under $1.75. That's not a typo—we're talking about a potential 88% additional selloff from current levels.
OWL currently sits just above a support shelf at $12.08, which represents the last meaningful line in the sand before that measured move target comes into play. The volume profile shows this decline has been orderly but persistent, without the panic selling that often creates short-term bounces.
What would invalidate this bearish outlook? A decisive reclaim of the Right Shoulder area around $21 would be the first step, but given the stock has already declined roughly 37% from that peak, such a recovery would require a fundamental catalyst strong enough to overcome this technical deterioration. For those considering the short side, the current setup offers a clear risk/reward framework with defined resistance overhead.
The $12.08 support level is where this story reaches its next chapter. A break below with conviction opens the door to that measured move playing out over the coming months. Conversely, a hold here with reversal patterns forming on shorter timeframes might offer a tradeable bounce back toward the $15-16 zone, though any rally would likely be capped by that descending trendline from the Head.
This chart serves as a reminder that sometimes the "invalid" patterns carry the most valuable lessons—when traditional setups don't form properly, it often signals something fundamentally broken beneath the surface. OWL's technical structure suggests the path of least resistance remains firmly to the downside until proven otherwise.
Author

Benjamin Pool
Verified Investing
A seasoned financial expert with a passion for empowering individuals to mastering smart money management.


