Block, Inc - XYZ (SQ2) Elliott Wave analysis and Elliott Wave technical forecast [Video]
![Block, Inc - XYZ (SQ2) Elliott Wave analysis and Elliott Wave technical forecast [Video]](https://editorial.fxsstatic.com/images/i/stock-02.jpg)
ASX: Block, Inc - XYZ (SQ2)
This Elliott Wave analysis highlights the latest insights on ASX-listed BLOCK, INC - XYZ (SQ2).
We identify a bullish scenario in ASX:XYZ with wave 3) orange in motion. Potential targets are projected between 125.44 and 159.74. This analysis not only outlines trend expectations and potential targets but also highlights crucial price levels to validate a continued bullish outlook.
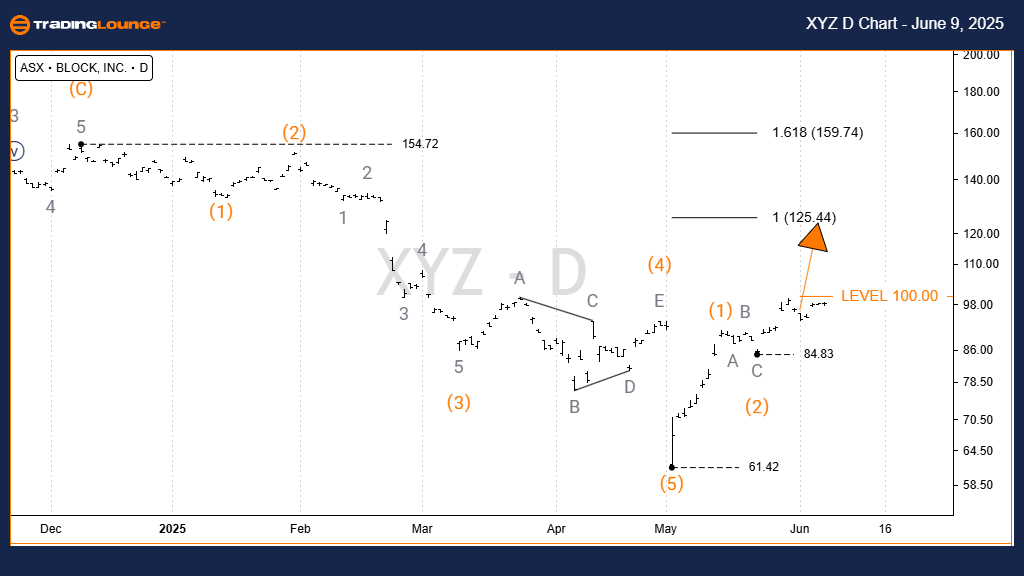
Elliott Wave technical analysis – One-day chart (semilog scale)
-
Function: Major Trend (Intermediate Degree, Orange).
-
Mode: Motive.
-
Structure: Impulse.
-
Position: Wave (3) Orange.
Details:
Following the 61.42 low, wave 1) orange has likely completed. Subsequently, wave 2) orange recently concluded near 84.83. This sets the stage for wave 3) orange, which is projected to ascend toward the 125.44 to 159.74 range. The view remains valid as long as the price stays above 84.83.
- Invalidation point: 84.83.
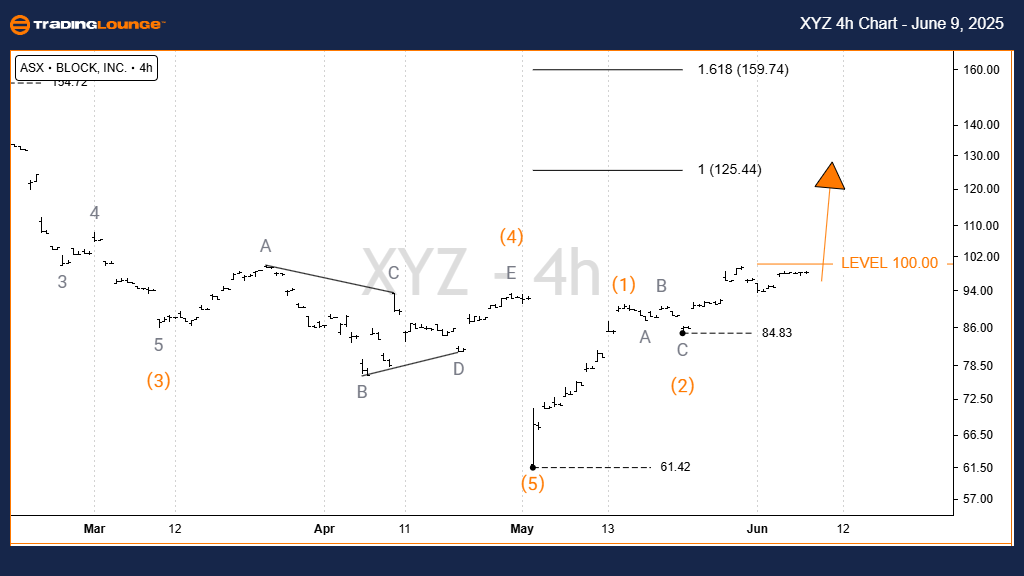
Elliott Wave technical analysis – TradingLounge (four-hour chart)
-
Function: Major Trend (Intermediate Degree, Orange).
-
Mode: Motive.
-
Structure: Impulse.
-
Position: Wave (3) Orange.
Details:
There is no deviation from the 1D chart outlook. Since the bottom at 61.42, wave 1) orange has probably concluded, and wave 2) orange also seems finalized around 84.83. We anticipate wave 3) orange to now be underway, targeting between 125.44 and 159.74. Maintaining this projection requires prices to hold above 84.83.
- Invalidation Point: 84.83.
Conclusion
Our comprehensive analysis and forecast for ASX: BLOCK, INC - XYZ (SQ2) deliver insights into market dynamics and actionable levels. These projections help investors recognize and act on high-probability movements. With clearly marked validation points, our analysis reinforces confidence and objectivity in the market perspective.
Block, Inc - XYZ (SQ2) Elliott Wave analysis and Elliott Wave technical forecast [Video]
Author

Peter Mathers
TradingLounge
Peter Mathers started actively trading in 1982. He began his career at Hoei and Shoin, a Japanese futures trading company.