|

BlackRock (BLK) next buying opportunity below $1,000

We previously mapped BlackRock’s (NYSE: BLK) bullish weekly path earlier this year. Today, our analysis continues with the Elliott Wave structure behind its rally from the 2022 low. This update highlights the next high-probability buying opportunity emerging for the stock.

Elliott Wave analysis

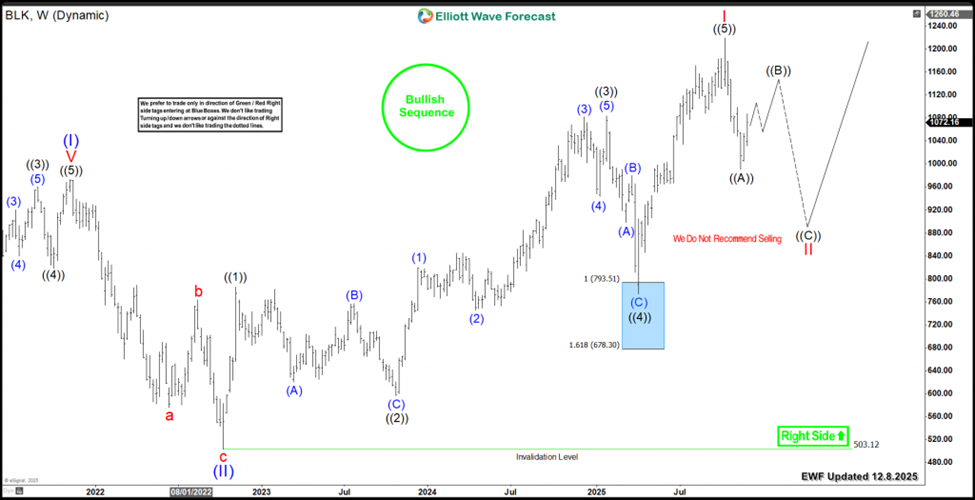
BlackRock‘s April 2025 correction marked wave ((4)), finding support in the Blue Box area $793-$678 . The subsequent rally to new highs then completed wave ((5)). This suggests the cycle from the 2022 low is mature and likely finished.

Currently, BLK holds above the April low of $773. This does not rule out a nesting pattern, but a larger wave II correction may have already begun. Consequently, as long as price stays below the October high of $1219, the path favors another leg down next year.

This larger correction could push BLK below $1,000. The 38.2% – 50% Fibonacci retracement zone sits at $946 – $861. This area will provide a strategic, diamond-level opportunity to position for the next uptrend, with a longer-term target toward $1500.

BlackRock (BLK) weekly chart 12.8.2025
Chart

Conclusion

BlackRock’s larger-degree bullish cycle remains firmly intact. Therefore, investors should continue targeting buying opportunities within weekly and daily pullbacks. Utilize our Elliott Wave strategy for precise entry timing. Specifically, establish positions after a 3, 7, or 11-swing correction completes. Additionally, our proprietary Blue Box system highlights high-probability zones with pinpoint accuracy. As a result, this disciplined method gives traders the clarity and confidence to catch the next bullish leg.

Author

Elliott Wave Forecast Team

Elliott Wave Forecast Team

ElliottWave-Forecast.com

More from Elliott Wave Forecast Team
Share:

Editor's Picks

GBP/USD remains slightly bid near 1.3300

GBP/USD now advances marginally and manages to dispute the 1.3300 region on Tuesday. Indeed, Cable regains some balance on the back of the lacklustre performance of the Greenback, all preceding the Fed’s meeting on Wednesday and the BoE’s gathering on Thursday.

EUR/USD recedes from tops, back below 1.1400

EUR/USD manages to set aside part of the recent weakness and clinches decent gains on Tuesday. Indeed, spot keeps the trade below the 1.1400 mark amid acceptable losses in the US Dollar, all following rising optimism of a US-Iran deal and steady caution prior to the FOMC gathering on Wednesday.

Gold bounces on poor US data

Gold remains under marked downside pressure on Tuesday, although the $4,000 zone per troy ounce emerges as a decent support for now. The precious metal’s pullback comes despite the modest losses in the US Dollar in a context of easing geopolitical tensions ahead of the key Fed event on Wednesday.

XRP falls toward $1.00 despite dwindling exchange reserves
Ripple (XRP) continues to trade under increasing pressure on Tuesday. This marks the second consecutive day of declines, reflecting broader risk-off sentiment as investors appear to shift gears in anticipation of the Federal Reserve (Fed) interest rate decision. On Wednesday, the Federal Open Market Committee (FOMC) is widely expected to leave interest rates unchanged in the 3.50%-3.75% range.
Warning signs in the stock market: Is this the top, or just a very short fuse?
Overnight, South Korea's Kospi fell more than 10%, SK Hynix lost close to 15% and Samsung Electronics lost 13%. Into that, Dow Jones Industrial Average futures traded up around 1% on paint and soft drinks, and S&P 500 futures sat roughly flat. An index that absorbs a memory-chip panic and prints nothing is not a calm market.
US Dollar mid-year outlook: Exceptional currency, exceptional risks?
The US Dollar enters the second half of 2026 in a markedly different position from a year ago. The King currency has recovered, reflecting persistent US inflation, changing expectations for Fed policy, geopolitical tensions and renewed demand for defensive assets.