Baidu Inc. is a Chinese multinational technology company specializing in internet related products and artificial intelligence (AI). The company offers various services, including a Chinese search engine, mapping service called Baidu Maps, an online encyclopedia Baidu Baike, a cloud storage service Baidu Wangpan and more.  Founded 2000, it is headquartered in Haidian District, Beijing, China. International investors can trade it under the ticker $9888 at HKEX. Also, one can trade Baidu under the ticker $BIDU at NASDAQ.

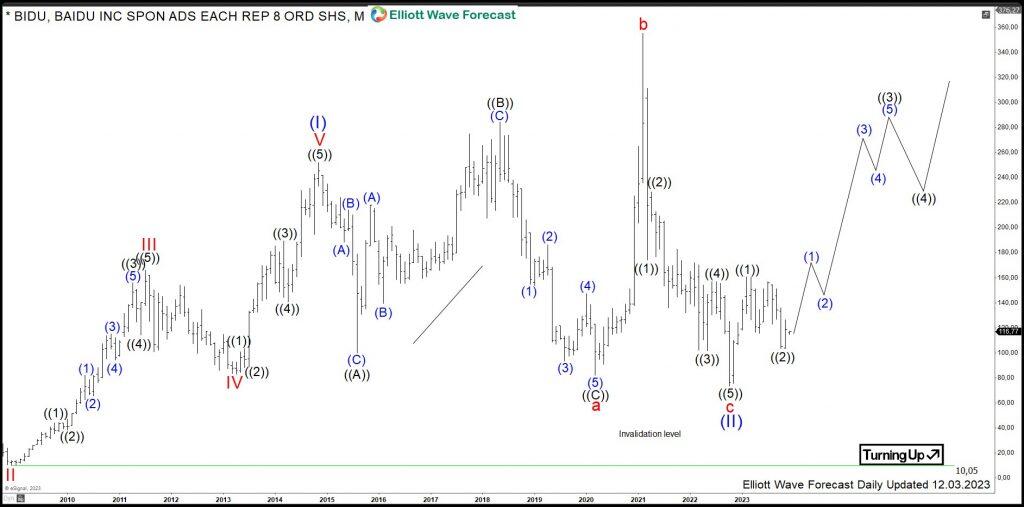
Baidu monthly Elliott Wave analysis

The monthly chart below shows the Baidu shares $BIDU traded at NASDAQ. From the IPO, the stock price has developed an initial cycle higher in blue wave (I) of super cycle degree towards 251.99 highs in November 2014. Hereby, both red waves III and V show an extension as related to the initial wave I. After the impulsive structure higher, a correction lower in blue wave (II) has unfolded as an Elliott wave expanded flat pattern being 3-3-5 structure.

Firstly, red wave a of blue wave (II) has printed a low at $82 in March 2020. Then, a bounce has set a connector wave b at $354.8 all-time highs in February 2021. Later on, the price has broken $82 lows confirming extension lower within red wave c of an expanded flat.  It is the preferred view, that blue wave (II) has bottomed in October 2022. While above $73.58, a new bullish cycle in blue wave (III) might have started and is now in the initial stages. The target will be 326-482 area and even higher.

Chart

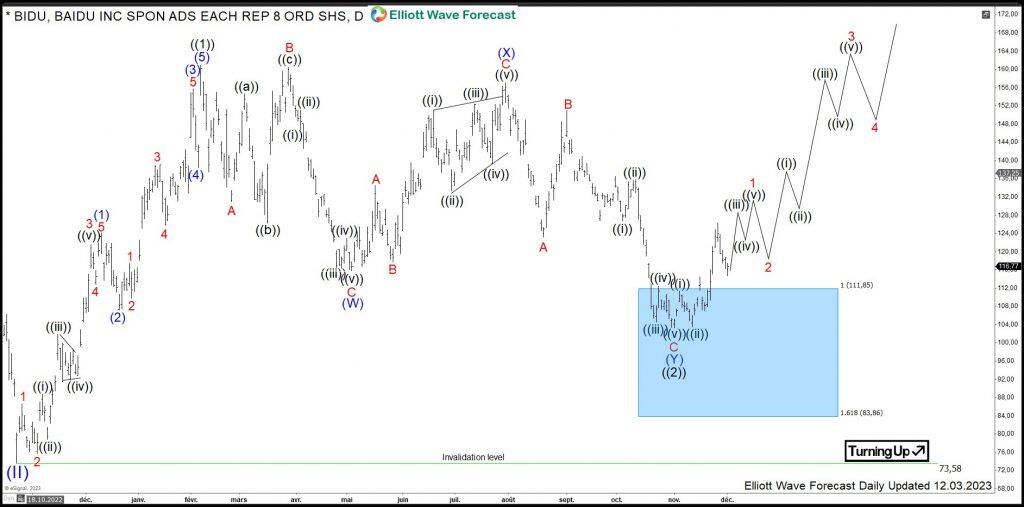
Baidu daily Elliott Wave analysis

The Daily chart below shows in more detail the initial stages of the blue wave (III). From the October 2022 lows at $73.58, black wave ((1)) demonstrates an impulse. It has peaked in February 2023 at $160.88. From there, pullback in black wave ((2)) has unfolded as a double three corrective structure.  Firstly, 3 swings of blue wave (W) have set a low in May 2023 at $115.74. Then, bounce in 3 swings of blue wave (X) has set a connector in July 2023 at $156.98. Later, the prices have broken 115.74 lows. As a consequence, it has created a bearish sequence. $BIDU stock has reached within blue wave (Y) the 100% extension range being 111.85-83.86 area.

It is the preferred view, that black wave ((2)) has bottomed in November 2023. While above $103.32, a next bull run in black wave ((3)) might have started. The target will be 191-245 area and even higher.

Investors and traders should stay long $BIDU from 111.85-83.86 bluebox targeting 191-245 area in the medium-term and 326-482 area in the long run.

Chart

Share: Feed news

FURTHER DISCLOSURES AND DISCLAIMER CONCERNING RISK, RESPONSIBILITY AND LIABILITY Trading in the Foreign Exchange market is a challenging opportunity where above average returns are available for educated and experienced investors who are willing to take above average risk. However, before deciding to participate in Foreign Exchange (FX) trading, you should carefully consider your investment objectives, level of xperience and risk appetite. Do not invest or trade capital you cannot afford to lose. EME PROCESSING AND CONSULTING, LLC, THEIR REPRESENTATIVES, AND ANYONE WORKING FOR OR WITHIN WWW.ELLIOTTWAVE- FORECAST.COM is not responsible for any loss from any form of distributed advice, signal, analysis, or content. Again, we fully DISCLOSE to the Subscriber base that the Service as a whole, the individual Parties, Representatives, or owners shall not be liable to any and all Subscribers for any losses or damages as a result of any action taken by the Subscriber from any trade idea or signal posted on the website(s) distributed through any form of social-media, email, the website, and/or any other electronic, written, verbal, or future form of communication . All analysis, trading signals, trading recommendations, all charts, communicated interpretations of the wave counts, and all content from any media form produced by www.Elliottwave-forecast.com and/or the Representatives are solely the opinions and best efforts of the respective author(s). In general Forex instruments are highly leveraged, and traders can lose some or all of their initial margin funds. All content provided by www.Elliottwave-forecast.com is expressed in good faith and is intended to help Subscribers succeed in the marketplace, but it is never guaranteed. There is no “holy grail” to trading or forecasting the market and we are wrong sometimes like everyone else. Please understand and accept the risk involved when making any trading and/or investment decision. UNDERSTAND that all the content we provide is protected through copyright of EME PROCESSING AND CONSULTING, LLC. It is illegal to disseminate in any form of communication any part or all of our proprietary information without specific authorization. UNDERSTAND that you also agree to not allow persons that are not PAID SUBSCRIBERS to view any of the content not released publicly. IF YOU ARE FOUND TO BE IN VIOLATION OF THESE RESTRICTIONS you or your firm (as the Subscriber) will be charged fully with no discount for one year subscription to our Premium Plus Plan at $1,799.88 for EACH person or firm who received any of our content illegally through the respected intermediary’s (Subscriber in violation of terms) channel(s) of communication.

Recommended content


Recommended content

Editors’ Picks

EUR/USD clings to gains above 1.0750 after US data

EUR/USD clings to gains above 1.0750 after US data

EUR/USD manages to hold in positive territory above 1.0750 despite retreating from the fresh multi-week high it set above 1.0800 earlier in the day. The US Dollar struggles to find demand following the weaker-than-expected NFP data.

EUR/USD News

GBP/USD declines below 1.2550 following NFP-inspired upsurge

GBP/USD declines below 1.2550 following NFP-inspired upsurge

GBP/USD struggles to preserve its bullish momentum and trades below 1.2550 in the American session. Earlier in the day, the disappointing April jobs report from the US triggered a USD selloff and allowed the pair to reach multi-week highs above 1.2600.

GBP/USD News

Gold struggles to hold above $2,300 despite falling US yields

Gold struggles to hold above $2,300 despite falling US yields

Gold stays on the back foot below $2,300 in the American session on Friday. The benchmark 10-year US Treasury bond yield stays in negative territory below 4.6% after weak US data but the improving risk mood doesn't allow XAU/USD to gain traction.

Gold News

Bitcoin Weekly Forecast: Should you buy BTC here? Premium

Bitcoin Weekly Forecast: Should you buy BTC here?

Bitcoin (BTC) price shows signs of a potential reversal but lacks confirmation, which has divided the investor community into two – those who are buying the dips and those who are expecting a further correction.

Read more

Week ahead – BoE and RBA decisions headline a calm week

Week ahead – BoE and RBA decisions headline a calm week

Bank of England meets on Thursday, unlikely to signal rate cuts. Reserve Bank of Australia could maintain a higher-for-longer stance. Elsewhere, Bank of Japan releases summary of opinions.

Read more

Forex MAJORS

Cryptocurrencies

Signatures