BHP Group Limited – BHP Elliott Wave analysis and technical forecast [Video]
![BHP Group Limited – BHP Elliott Wave analysis and technical forecast [Video]](https://editorial.fxsstatic.com/images/i/car-industry-02_XtraLarge.jpg)
Our Elliott Wave analysis today focuses on the Australian Stock Exchange (ASX), specifically BHP GROUP LIMITED – BHP. We observe that the third wave (wave 3) – navy) may be starting to develop strongly upward. In this article, we update the short‑term outlook, highlight potential trends and optimal entry points, and specify the invalidation point for the bullish trend.
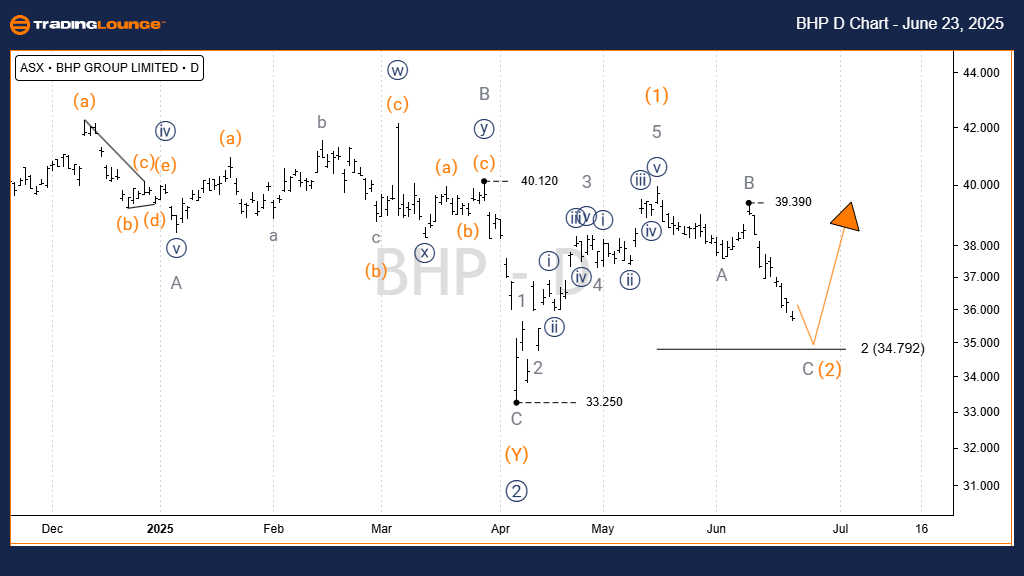
ASX: BHP Elliott Wave Technical Analysis – One‑day chart
-
Function: Major trend (Intermediate degree, orange).
-
Mode: Motive.
-
Structure: Impulse.
-
Position: Wave 3) – orange.
-
Details: Wave 2) – navy may have concluded, and Wave 3) – navy might be advancing. It subdivides into Wave 3) – orange, potentially heading toward the 40.00 target. In the short term, Wave 2) – orange may dip toward 34.792, then a move above 39.390 would confirm Wave 3) – orange is unfolding.
-
Invalidation point: 33.25.
-
Confirmation point: 39.390.
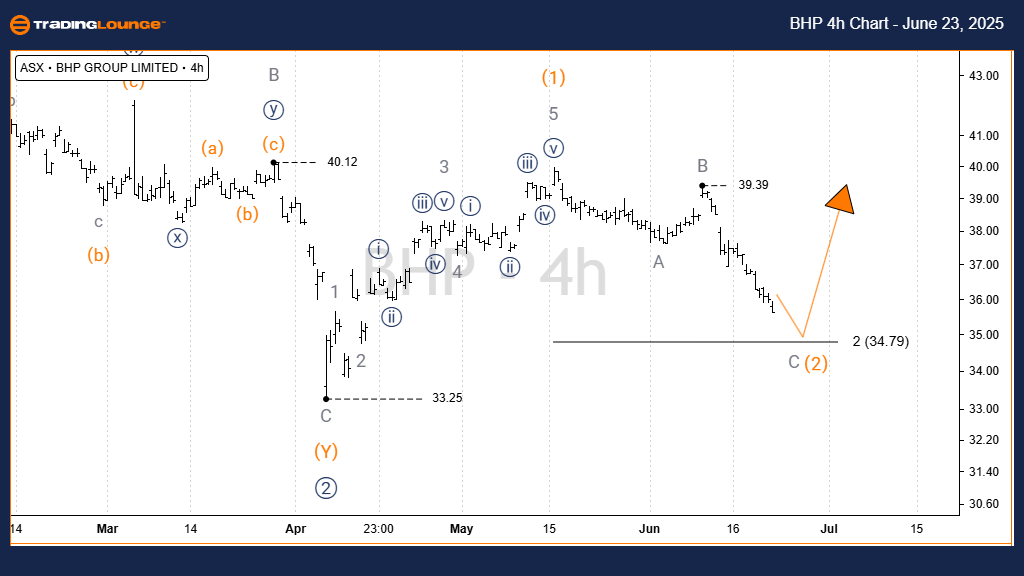
Elliott Wave technical analysis – Four‑hour chart
-
Function: Major trend (Intermediate degree, orange).
-
Mode: Motive.
-
Structure: Impulse.
-
Position: Wave 3) – orange.
-
Details: We’re likely nearing completion of Wave 2) – orange, after counting waves A, B, C – grey. Wave C – grey is approaching a potential reversal area around 34.792. A strong bounce there and a push above 39.390 high would mark the beginning of Wave 3) – orange.
-
Invalidation point: 84.83 (Note: Invalidation seems mistakenly high; likely meant 33.83 or similar—please double‑check.).
-
Confirmation point: 39.390.
Conclusion
Our analysis and short‑term forecast for ASX: BHP GROUP LIMITED – BHP aim to give readers a clear view of current market trends and how to act on them. The specific price validation and invalidation levels support confidence in our wave count. We strive to deliver the most objective and professional insights on market trends.
BHP Group Limited – BHP Elliott Wave analysis and technical forecast [Video]
Author

Peter Mathers
TradingLounge
Peter Mathers started actively trading in 1982. He began his career at Hoei and Shoin, a Japanese futures trading company.


