Bharat Electronics (BEL) – Elliott Wave technical analysis [Video]
![Bharat Electronics (BEL) – Elliott Wave technical analysis [Video]](https://editorial.fxsstatic.com/images/i/electronic-chips-01_XtraLarge.jpg)
Bharat Electronics Elliott Wave technical review – Day chart
Function: Counter-Trend.
Mode: Corrective.
Structure: Orange Wave 4.
Position: Navy Blue Wave 1.
Direction next higher degrees: Orange Wave 5.
Details: Orange Wave 3 appears completed. Currently, Orange Wave 4 is active.
Invalidation level: 256.
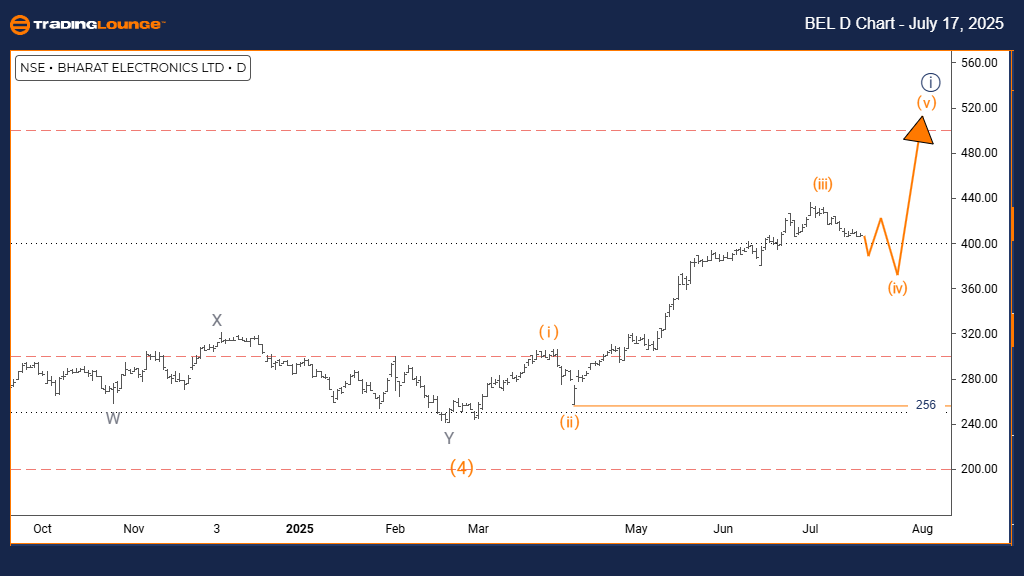
The daily Elliott Wave analysis for BHARAT ELECTRONICS indicates the stock is experiencing a corrective phase, defined as a counter-trend move. The market is developing an Orange Wave 4 within a larger Navy Blue Wave 1 structure. This points to a retracement in progress against the dominant trend.
Technical confirmation supports the completion of Orange Wave 3, leading into the formation of Orange Wave 4. This stage typically acts as a pullback before the trend resumes with the expected development of Orange Wave 5.
The corrective wave characteristically shows reduced momentum, distinct from the stronger impulsive waves. This period might show sideways or limited retracements. After this, the market is likely to progress into Orange Wave 5, concluding the present cycle. The critical invalidation point stands at 256 – any drop below this level would invalidate the current wave count and suggest a re-evaluation of the setup.
This structure offers traders a lens to anticipate the end of the correction and prepare for upcoming price moves. Since Orange Wave 4 lies within Navy Blue Wave 1, it suggests a brief consolidation within a broader trend structure. Maintaining price levels above 256 supports the current bullish expectation.
Traders should closely observe Orange Wave 4 for signs of waning strength. Such signals can indicate a shift toward the next impulsive phase. This analysis highlights the transitional nature of the current market state within the broader wave context.
By applying this Elliott Wave perspective, traders can better recognize potential turning points between correction and trend. The 256 invalidation point provides a clear benchmark for managing risk. The daily chart delivers key short-term insights into the stock’s positioning within a larger wave pattern, with potential for a near-term continuation of the primary trend.
Bharat Electronics Elliott Wave technical review – Weekly chart
Function: Bullish Trend.
Mode: Impulsive.
Structure: Navy Blue Wave 1.
Position: Gray Wave 1.
Direction next lower degrees: Navy Blue Wave 2.
Details: Orange Wave 4 appears completed. Now, Navy Blue Wave 1 of 5 is unfolding.
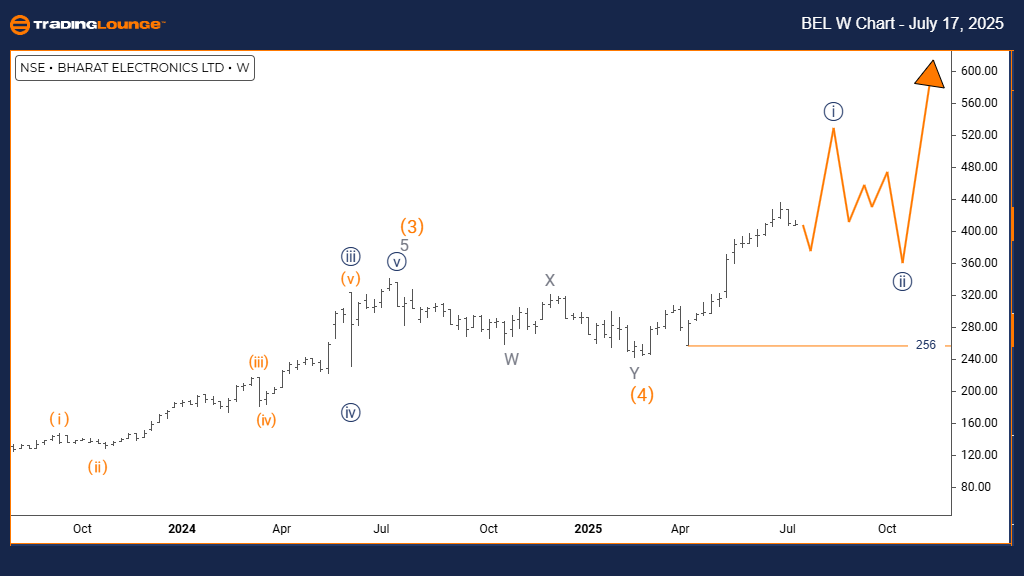
The weekly Elliott Wave analysis for BHARAT ELECTRONICS outlines a bullish market phase marked by impulsive price movement. The market is forming a Navy Blue Wave 1 within a broader Gray Wave 1, suggesting the stock has entered an early stage of a new upward trend cycle.
Technical signals confirm that Orange Wave 4 has concluded, transitioning the stock into Navy Blue Wave 1 of 5. This development reflects the start of an impulsive sequence, offering strong upward momentum and the potential for sustained bullish movement.
The impulsive pattern features consistent higher highs and higher lows, a sign of a strong trend. The current setup implies that BHARAT ELECTRONICS has exited its previous correction and started a fresh wave of gains. Within Gray Wave 1, the ongoing Navy Blue Wave 1 sets the tone for further advances.
This analysis framework helps traders identify where the stock is within the larger trend cycle. It supports the view that this could be the initial stage of a stronger upward move. The weekly timeframe underlines the momentum's strength and shows the start of a fresh impulsive series, which traders may use for timing strategic entries.
The wave structure highlights persistent buying pressure and likely continuation after short-term pullbacks. Impulsive traits, seen in price strength, suggest institutional activity and strong demand. Traders can benefit from understanding this wave transition—Orange Wave 4 ending and Navy Blue Wave 1 beginning—as a potential turning point.
This provides context for aligning trading strategies with the dominant upward direction. With bullish momentum in place, traders might anticipate further expansion as the impulsive wave continues developing.
Bharat Electronics (BEL) – Elliott Wave technical analysis [Video]
Author

Peter Mathers
TradingLounge
Peter Mathers started actively trading in 1982. He began his career at Hoei and Shoin, a Japanese futures trading company.


