Bharat Electronics (BEL) Elliott Wave technical analysis [Video]
![Bharat Electronics (BEL) Elliott Wave technical analysis [Video]](https://editorial.fxsstatic.com/images/i/electronic-chips-01.jpg)
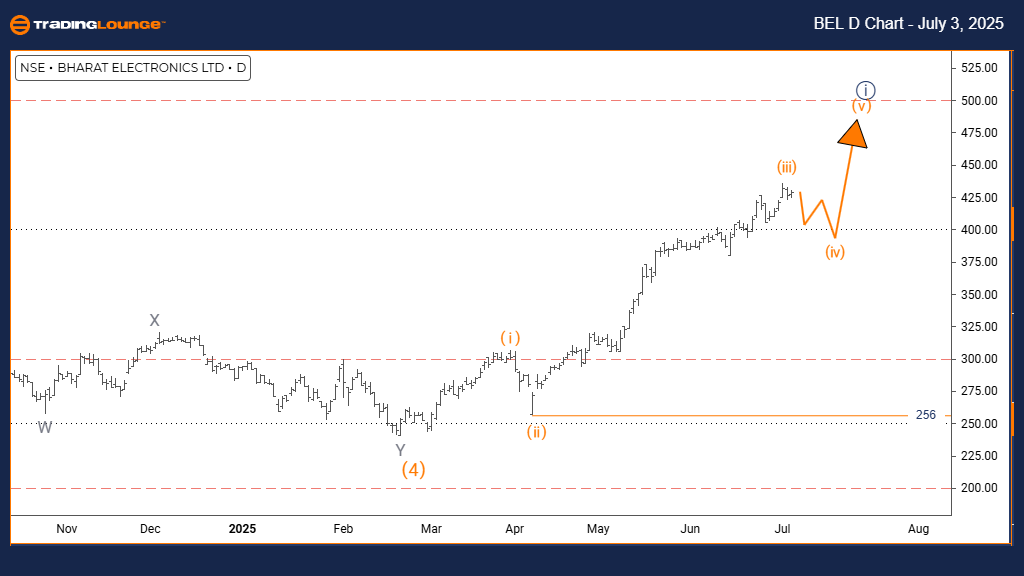
Bharat Electronics Elliott Wave Analysis – Daily chart
Function: Counter Trend.
Mode: Corrective.
Structure: Orange wave 4.
Position: Navy blue wave 1.
Direction next higher degrees: Orange wave 5.
Details: Orange wave 3 appears complete, and orange wave 4 is currently unfolding.
Wave cancel invalid level: 256.
The BHARAT ELECTRONICS daily chart shows a counter-trend movement based on Elliott Wave analysis. The current price action indicates a corrective move, suggesting a short-term retracement within a broader upward trend. Structurally, orange wave 4 is developing as part of navy blue wave 1, implying the stock is undergoing a typical pullback before potentially resuming its primary trend direction.
Orange wave 3 seems to have reached its end, signaling the start of orange wave 4. This phase is normally corrective and retraces a portion of the preceding wave. The upcoming move at a higher degree is expected to be orange wave 5, which would follow the completion of orange wave 4 and may align with the prevailing market trend.
Currently, BHARAT ELECTRONICS is navigating through orange wave 4 after wrapping up orange wave 3. This correction suggests sideways movement or slight declines before the price continues upward. Its position within navy blue wave 1 supports the view of an ongoing correction phase within a larger bullish structure.
The key level to watch is 256—this is the wave invalidation point. If the stock price falls below this level, the current wave structure would be invalid and the counter-trend outlook would need to be re-evaluated. As long as the price holds above this threshold, the correction pattern remains valid.
Traders should observe orange wave 4 closely for signs of completion. Once this corrective wave ends, orange wave 5 may begin, continuing the overall upward trend. The current pattern suggests a temporary consolidation before a potential breakout.
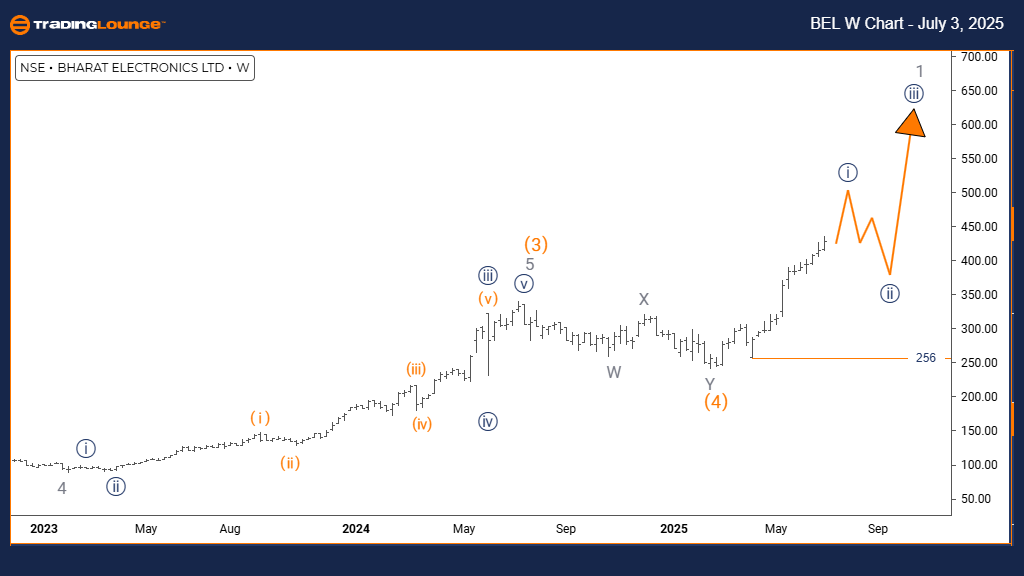
Bharat Electronics Elliott Wave analysis – Weekly chart
Function: Bullish Trend.
Mode: Impulsive.
Structure: Navy blue wave 1.
Position: Gray wave 1.
Direction next lower degrees: Navy blue wave 2.
Details: Navy blue wave 1 is still active.
Wave cancel invalid level: 256.
The BHARAT ELECTRONICS weekly Elliott Wave chart confirms an ongoing bullish trend. Price action is currently in impulsive mode, indicating strong upward momentum. The present wave structure, navy blue wave 1, is part of a broader sequence within gray wave 1. This suggests the stock is in the early phase of a new uptrend within a larger bullish cycle.
Navy blue wave 1 continues to unfold within gray wave 1. This wave phase usually marks the beginning of a fresh trend and often features pronounced directional moves. Once this wave completes, the market is expected to enter navy blue wave 2, typically a corrective pullback before the bullish trend resumes.
The key level to observe is 256—the invalidation point for the current wave structure. A decline below this mark would invalidate the wave count and require a reassessment of the bullish scenario. Until then, the wave setup remains consistent with an upward market direction.
This technical setup points to possible continued gains for BHARAT ELECTRONICS. With navy blue wave 1 still in motion within gray wave 1, the impulsive character implies strong buying pressure and the potential for further price increases in upcoming sessions.
Bharat Electronics (BEL) Elliott Wave technical analysis [Video]
Author

Peter Mathers
TradingLounge
Peter Mathers started actively trading in 1982. He began his career at Hoei and Shoin, a Japanese futures trading company.


