|

BEAMX buyers getting ready for the next extreme area

BEAMX token is a Confidential Asset issued on top of the Beam blockchain. In today’s article, we’ll dive into the Elliott Wave structure taking place and we’ll explore the potential path based on the Theory.

Merit Circle (MC) token redenomination and rebranding to Beam (BEAMX) took place on November 2023. Since then, the new coin rallied for +800% in 4 months within an impulsive 5 waves structure. The initial move is designed to be a wave ((1)) and it’s currently followed by decline to correct the previous cycle in wave ((2)).

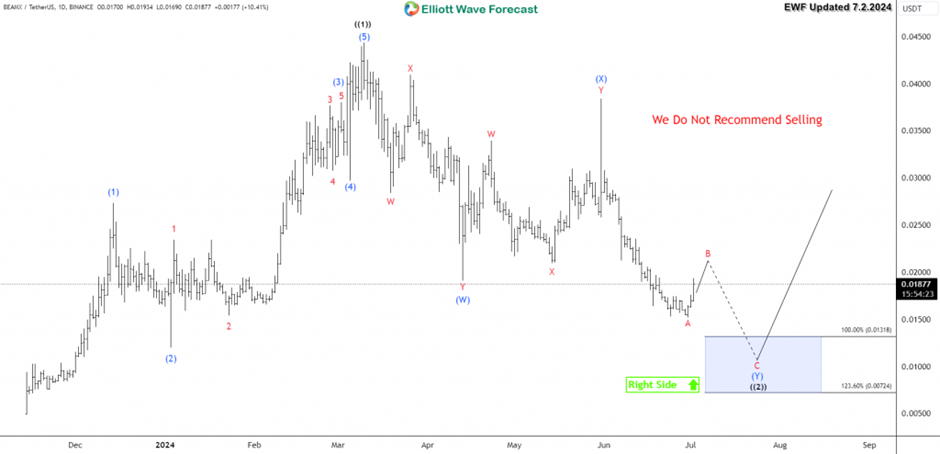
The cycle from March 2024 peak is unfolding within a Double Three corrective structure and it’s currently showing 5 swings to the downside. Therefore, we can expect still 2 more swings to finish a 7 swing structure toward the equal legs area at $0.013 – $0.007. This extreme blue box area is expected to provide support for the token and a daily reversal will take place from there to start the next leg to the upside within wave ((3)). Investors are expected to show up within the mentioned extreme area in preparation for a new daily cycle to the upside and they will be looking for an initial target around $0.063 area.

BEAMX daily chart 7.2.2024

Setup Recap 

-Time Frame : Daily

-Entry Area : $0.013 – $0.0072

-Invalidation Condition : Daily Close below $0.005

-Target : $0.063

-Ratio : 6.25 RR

Author

Elliott Wave Forecast Team

Elliott Wave Forecast Team

ElliottWave-Forecast.com

More from Elliott Wave Forecast Team
Share:

Markets move fast. We move first.

Orange Juice Newsletter brings you expert driven insights - not headlines. Every day on your inbox.

By subscribing you agree to our Terms and conditions.

Editor's Picks

EUR/USD meets some support near 1.1670

EUR/USD further extends its bearish leg on Wednesday, coming under extra pressure and breaching below the 1.1700 level to flirt with four-week troughs in a context of marginal gains in the US Dollar ahead of the key US NFP on Friday.

GBP/USD consolidates above mid-1.3400s; bullish potential seems intact

The GBP/USD pair is seen consolidating its heavy losses registered over the past two days and oscillating in a narrow trading band, just above mid-1.3400s during the Asian session on Thursday. However, the fundamental backdrop warrants some caution for bearish traders and before positioning for an extension of the retracement slide from the 1.3565-1.3570 region, or the highest level since September 18, touched on Tuesday.

Gold declines to near $4,450 as safe-haven demand eases

Gold price declines to near $4,450 during the early Asian trading hours on Thursday. The precious metal loses momentum as traders book profits after a recent rally. Later on Thursday, the weekly US Initial Jobless Claims data will be released. The attention will shift to the US December employment report on Friday. 

XRP faces selling pressure as key on-chain metric resets and ETF inflows weaken

Ripple (XRP) is trading downward but holding support at $2.22 at the time of writing on Wednesday, as fear spreads across the cryptocurrency market, reversing gains made from the start of the year.

2026 economic outlook: Clear skies but don’t unfasten your seatbelts yet

Most years fade into the background as soon as a new one starts. Not 2025: a year of epochal shifts, in which the macroeconomy was the dog that did not bark. What to expect in 2026? The shocks of 2025 will not be undone, but neither will they be repeated.

XRP battles selling pressure as profit-taking, ETF inflows shape outlook

Ripple (XRP) is trading downward but holding support at $2.22 at the time of writing on Wednesday, as fear spreads across the cryptocurrency market, reversing gains made from the start of the year.