Bank of America (BAC) rallies strongly from the buying zone

In this technical article, we are going to present Elliott Wave trading setup of Bank of America (BAC) . The stock completed its corrective decline precisely at the Equal Legs area, also known as the Blue Box. In the following sections, we’ll break down the Elliott Wave structure in detail and explain the setup and present the target levels.
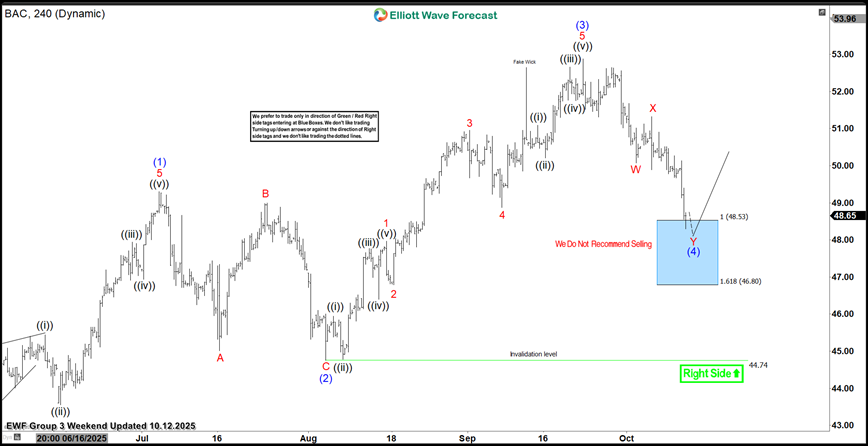
BAC Elliott Wave four-hour chart 10.12.2025
The current analysis suggests that BAC stock is forming a wave (4) pull back, which is unfolding as an Elliott Wave Double Three pattern . Blue Box comes at 48.53-46.8. That is our buying zone. We recommend members avoid selling BAC stock, as the main trend remains bullish. We anticipate at least a 3-wave bounce from this Blue Box area. Once the price touches the 50% fib level against the X red connector, we’ll make positions risk-free, set the stop-loss at breakeven, and book partial profits. Stop Loss is placed a few points below 1.618 fib extension : 46.8.
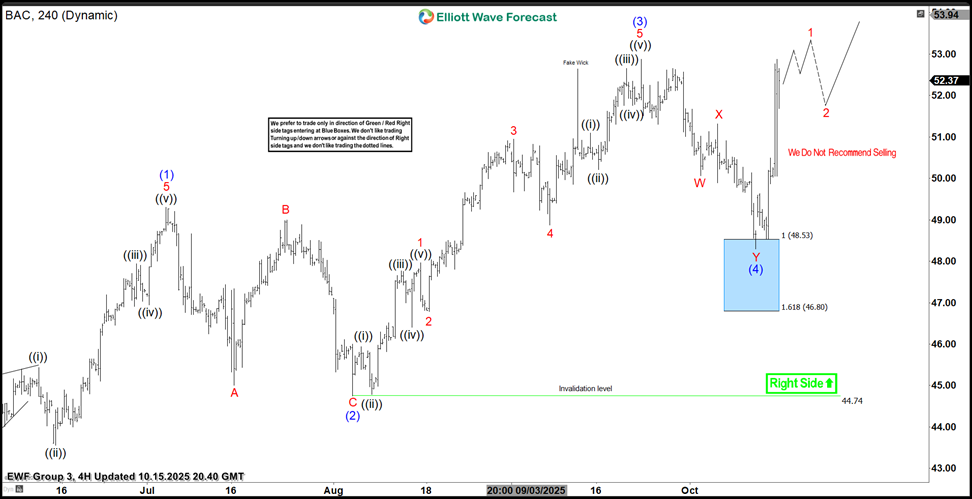
BAC Elliott Wave four-hour chart 10.12.2025
The stock found buyers into the Blue Box area, just as expected. The stock made a decent reaction higher from our buying zone. As a result all long positions are risk free + partial profits have been taken. As long as price holds pivot at the 48.32 low , further upside remains likely, targeting 53.95-55.69 area next.
Author

Elliott Wave Forecast Team
ElliottWave-Forecast.com


