We will look at the bearish sequence in BAC (Bank of America) and present two views that are slightly different in terms of the extent of the bounce but both are calling for an extension lower. We will also look at the area that can act as a floor for BAC and where buyers should appear to resume the rally for the next long-term rally or produce 3 waves bounce at a minimum.
Bank of America Elliott Wave sequence
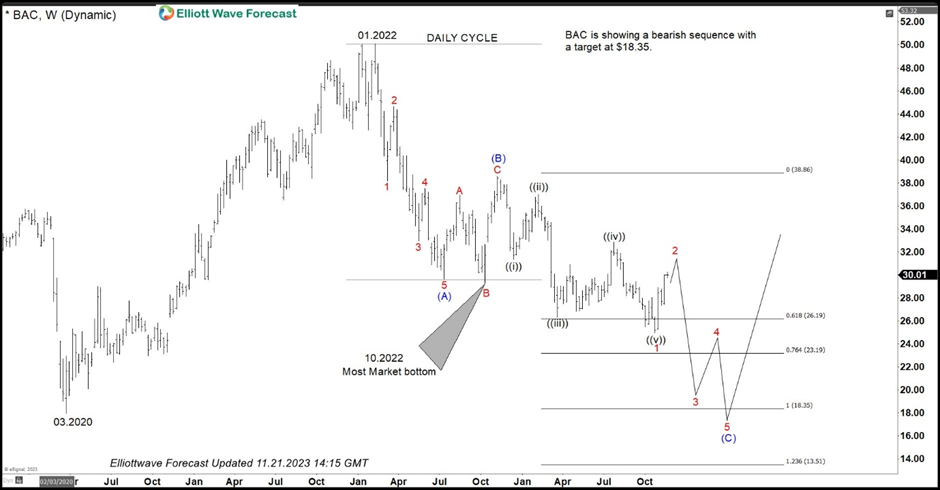
The chart below is the weekly chart of Bank of America (BAC) and it shows an incomplete bearish sequence down from the January 2022 peak against the November 2022 peak. The initial decline from the January 2022 peak was in 5 waves which ended at $29.67 and wave (B) ended at $38.86 as a 3-3-5 FLAT correction. BAC has since then made a new low below $29.67 July 2022 low which created an incomplete bearish sequence and has opened an extension lower. Decline from (B) high is in 5 swings so as bounces fail below (B) high, expect more downside toward $18.35 – $13.51 area to complete the sequence from January 2022 peak and then BAC stock should turn up to resume the rally or put in a larger 3 waves bounce at least.
Bank of America (BAC) extended bounce
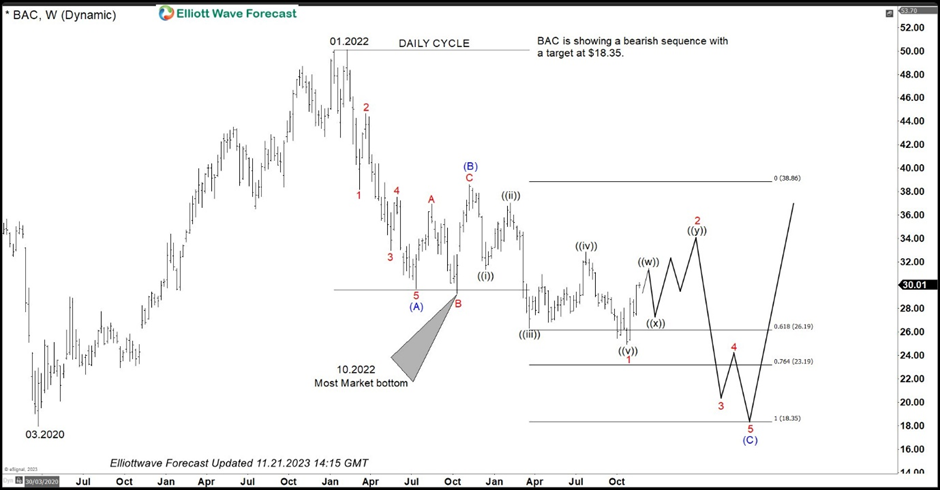
View The chart below shows the idea of an extended bounce in 7 swings before the decline resumes. $31.39 – $33.92 is the area to end 3 swings up from the low and from this area, stock could resume the decline for a new low or it could pull back in 3 waves and then do another 3 swings higher to complete 7 swings up from the low. In either case, as bounces fail below (B) high, expect more downside to take place.
FURTHER DISCLOSURES AND DISCLAIMER CONCERNING RISK, RESPONSIBILITY AND LIABILITY Trading in the Foreign Exchange market is a challenging opportunity where above average returns are available for educated and experienced investors who are willing to take above average risk. However, before deciding to participate in Foreign Exchange (FX) trading, you should carefully consider your investment objectives, level of xperience and risk appetite. Do not invest or trade capital you cannot afford to lose. EME PROCESSING AND CONSULTING, LLC, THEIR REPRESENTATIVES, AND ANYONE WORKING FOR OR WITHIN WWW.ELLIOTTWAVE- FORECAST.COM is not responsible for any loss from any form of distributed advice, signal, analysis, or content. Again, we fully DISCLOSE to the Subscriber base that the Service as a whole, the individual Parties, Representatives, or owners shall not be liable to any and all Subscribers for any losses or damages as a result of any action taken by the Subscriber from any trade idea or signal posted on the website(s) distributed through any form of social-media, email, the website, and/or any other electronic, written, verbal, or future form of communication . All analysis, trading signals, trading recommendations, all charts, communicated interpretations of the wave counts, and all content from any media form produced by www.Elliottwave-forecast.com and/or the Representatives are solely the opinions and best efforts of the respective author(s). In general Forex instruments are highly leveraged, and traders can lose some or all of their initial margin funds. All content provided by www.Elliottwave-forecast.com is expressed in good faith and is intended to help Subscribers succeed in the marketplace, but it is never guaranteed. There is no “holy grail” to trading or forecasting the market and we are wrong sometimes like everyone else. Please understand and accept the risk involved when making any trading and/or investment decision. UNDERSTAND that all the content we provide is protected through copyright of EME PROCESSING AND CONSULTING, LLC. It is illegal to disseminate in any form of communication any part or all of our proprietary information without specific authorization. UNDERSTAND that you also agree to not allow persons that are not PAID SUBSCRIBERS to view any of the content not released publicly. IF YOU ARE FOUND TO BE IN VIOLATION OF THESE RESTRICTIONS you or your firm (as the Subscriber) will be charged fully with no discount for one year subscription to our Premium Plus Plan at $1,799.88 for EACH person or firm who received any of our content illegally through the respected intermediary’s (Subscriber in violation of terms) channel(s) of communication.
Recommended content
Editors’ Picks

Gold falls amid a possible de-escalation of US-China tensions Premium
Gold pulled back from its all-time high of $3,500 per troy ounce reached earlier on Tuesday, as a resurgent US Dollar and signs of easing tensions in the US–China trade dispute appeared to draw sellers back into the market.

EUR/USD retreats to daily lows near 1.1440
EUR/USD loses the grip and retreats to the 1.1440 zone as the Greenback’s rebound now gathers extra steam, particulalry after some positive headlines pointing to mitigating trade concerns on the US-China front on Tuesday.

GBP/USD deflates to weekly lows near 1.3350
GBP/USD loses further momentum and recedes to the 1.3350 zone on Tuesday, or two-day troughs, all in response to the frmer tone in the US Dollar and encouraging news from the US-China trade scenario.

Ethereum rallies 10% amid decline in CME short positions
Ethereum saw a 10% gain on Tuesday after the general crypto market rallied alongside Bitcoin. The rally comes after the ETH Chicago Mercantile Exchange basis plunged from 20% in November to about 5% in April.

Five fundamentals for the week: Traders confront the trade war, important surveys, key Fed speech Premium
Will the US strike a trade deal with Japan? That would be positive progress. However, recent developments are not that positive, and there's only one certainty: headlines will dominate markets. Fresh US economic data is also of interest.

The Best brokers to trade EUR/USD
SPONSORED Discover the top brokers for trading EUR/USD in 2025. Our list features brokers with competitive spreads, fast execution, and powerful platforms. Whether you're a beginner or an expert, find the right partner to navigate the dynamic Forex market.