Axis Bank Elliott Wave technical analysis [Video]
![Axis Bank Elliott Wave technical analysis [Video]](https://editorial.fxsstatic.com/images/i/supermicro-01.jpg)
AXIS Bank Elliott Wave technical analysis – Day chart
Function: Counter Trend.
Mode: Corrective.
Structure: Navy Blue Wave 2.
Position: Gray Wave 5.
Direction (next higher degree): Navy Blue Wave 3.
Details: Completion of navy blue wave 1, currently forming navy blue wave 2 of 5.
Invalidation level: 932.
Market overview and structure
The daily Elliott Wave chart for AXIS BANK highlights a corrective counter-trend move. The chart structure reveals that the stock is within navy blue wave 2, a part of a broader gray wave 5 cycle. This indicates a temporary retracement amid an overall upward trend.
The completion of navy blue wave 1 marks the beginning of wave 2's development. As a corrective phase, this suggests a pause in momentum before a likely continuation. The next projected movement in the higher degree structure is navy blue wave 3, which signals a return to trend direction.
Critical price levels and market behavior
The defined invalidation level is 932, which serves as a key risk marker. If prices move below this threshold, the current wave count becomes invalid, prompting a reassessment of the setup.
Given the corrective nature of wave 2, the market may show limited directional strength, possibly leading to sideways or downward action. Traders are advised to wait for wave 2’s completion before expecting the initiation of navy blue wave 3, which would suggest a stronger directional bias.
Strategic implications for traders
This wave analysis provides a guideline for interpreting market movement through Elliott Wave principles. The reduced momentum within corrective phases like wave 2 emphasizes caution. Traders should monitor for wave completion and use the 932 level as a critical reference point for managing positions.
This setup provides actionable insights, helping market participants align with Elliott Wave structures and apply risk-managed trading decisions.
-638880728061088822.png)
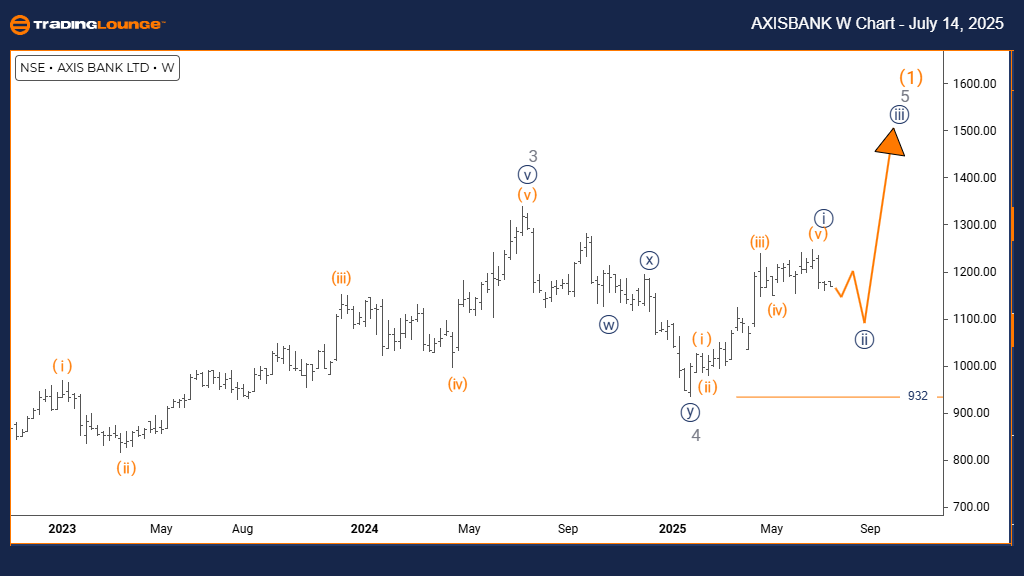
AXIS Bank Elliott Wave technical analysis – Weekly chart
Function: Counter Trend.
Mode: Corrective.
Structure: Navy Blue Wave 2.
Position: Gray Wave 5.
Direction (next higher degree): Navy Blue Wave 3.
Details: Navy blue wave 1 appears completed, wave 2 of 5 currently unfolding.
Invalidation level: 932.
Market outlook and structure overview
The Elliott Wave analysis on AXIS BANK’s weekly chart indicates a counter-trend phase with corrective movement dominating the current market behavior. The ongoing structure aligns with navy blue wave 2 within a broader gray wave 5 framework, signaling a temporary retracement phase in the long-term uptrend.
The previous navy blue wave 1 appears to be completed. Now, the market is progressing through wave 2 of 5, a stage typically identified as a pullback period before a new directional phase begins. This is expected to be followed by navy blue wave 3, which represents a potential trend resumption.
Key levels and technical considerations
The corrective nature of wave 2 implies reduced momentum, often resulting in sideways or downward market movements. This contrasts with the stronger impulses typically seen in trending waves. The invalidation level is set at 932—a critical price threshold that, if breached, would invalidate the current wave structure and require reevaluation.
This setup provides a strategic outlook for traders, emphasizing the importance of confirming the completion of wave 2 before expecting a shift into the more impulsive wave 3 phase. The invalidation level gives traders a precise risk management benchmark.
Strategic insights for market participants
This Elliott Wave interpretation offers a broader perspective, particularly useful for those analyzing multi-timeframe trends. The technical framework helps identify potential turning points in the price cycle, aligning short-term decisions with long-term structural patterns.
Traders should monitor this wave development carefully and be prepared for a likely transition from corrective to impulsive movement, especially once wave 2 completes. Proper positioning and risk control hinge on respecting the 932 invalidation level.
AXIS Bank Elliott Wave technical analysis [Video]
Author

Peter Mathers
TradingLounge
Peter Mathers started actively trading in 1982. He began his career at Hoei and Shoin, a Japanese futures trading company.


