Australian miner Oz Minerals (OZL Stock) should continue higher

Oz Minerals is an Australian mining company. The main products are gold and copper. Formed in 2008 after the merger of Oxiana Limited and Zinifex, it is based in Adelaide, Australia. One can trade it under the ticker $OZL at ASE.
Since 2020, we see a strong rally in all metals. Therefore, one should expect mining companies to profit substantially from the rising prices of the underlying assets. Indeed, we see Oz Minerals turning higher from 2013 lows. Without any doubt, the rising gold prices since 2015 have supported the $OZL stock. Then, from 2020 lows, a strong push higher in Copper has provided an additional effect to the company stock. Now, we expect more upside in both gold and copper. Therefore, Oz Minerals should remain profitable for both investors and traders as it offers a considerable upside in the next future.
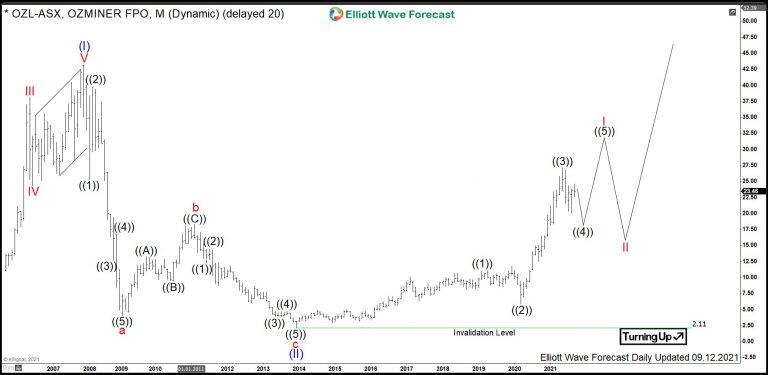
Oz Minerals monthly Elliott Wave analysis
The monthly chart below shows the Oz Minerals stock $OZL at ASE. From the all-time lows, the stock price has developed a cycle higher in wave (I) of a super cycle degree. Hereby, $OZL has printed the all-time high on November 2007 at 43.20. From the 2007 highs, a correction lower has unfolded as a zigzag correction in the blue wave (II). It has ended correcting the previous super cycle by printing an important bottom in December 2013 at 2.11.
From the 2013 lows at 2.11, a new cycle in wave (III) has already started. Clear break above 43.20 highs will confirm that. Right now, the wave (III) might be within a red wave I. Hereby, initial nest comprising waves ((1)) and ((2)) of red wave I has been formed. It has ended on March 2020. From the March 2020 lows, waves ((3))-((4))-((5)) should accomplish the wave I. Then, one should expect a pullback in red wave II and an acceleration higher in red wave III of the blue wave (III). The target for the wave ((III)) will be 45.14-71.79 area and possibly higher.
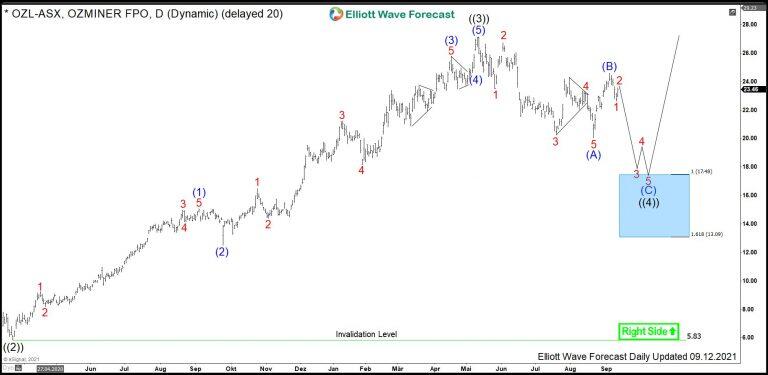
Oz Minerals daily Elliott Wave analysis
The daily view demonstrates the advance from the March 2020 lows in black wave ((3)). From the 5.83 lows, wave ((3)) shows an extension as it has clearly reached beyond the 1.618 multiples of the length of the wave ((1)). It has ended in May 2021 at 27.15. From the highs, a pullback in wave ((4)) should find support above 5.83 lows for an extension in black wave ((5)).
Traders can be looking to buy 3 swings lower into the balck wave ((5)). While below 24.60 highs, one can buy $OZL from 17.48-13.09 area. There, a rally to new highs or a bounce in 3 waves as minimum should be expected.
By contrast, long-term investors should wait for waves ((4))-((5)) of red wave I to end. Then, a consolidation lower in red wave II will provide a long-term opportunity in the monthly timeframe.
Premium
You have reached your limit of 3 free articles for this month.
Start your subscription and get access to all our original articles.
Author

Elliott Wave Forecast Team
ElliottWave-Forecast.com


