Australian Dollar edges higher as US Dollar depreciates ahead of PMI data
- The Australian Dollar remains stronger after the release of Purchasing Managers Index data on Thursday.
- Australia's Judo Bank Services PMI inched up to 50.6 in October, marking its ninth consecutive month of expansion.
- The Fed Beige Book report indicated that economic activity was "little changed in nearly all Districts.”

The Australian Dollar (AUD) edges higher against the US Dollar (USD) after the release of the domestic Purchasing Managers Index (PMI) on Thursday. Additionally, the AUD/USD pair gained as the USD weakened slightly, driven by a modest dip in US Treasury yields. 2-year and 10-year yields on US Treasury bonds stand at 4.07% and 4.23%, respectively, at the time of writing.
The AUD could get further support from the prevailing hawkish sentiment surrounding the Reserve Bank of Australia (RBA), bolstered by the positive employment data. Earlier this week, RBA Deputy Governor Andrew Hauser noted that the labor participation rate is remarkably high and emphasized that while the RBA is data-dependent, it is not data-obsessed.
The US Dollar faced downward pressure following the release of the Federal Reserve’s (Fed) Beige Book on Wednesday. The latest report indicated that economic activity was "little changed in nearly all Districts," in contrast to August's report, where three Districts reported growth and nine showed flat activity.
Traders are likely to keep an eye on the S&P Global Purchasing Managers Index (PMI), a leading indicator gauging US private-business activity in the manufacturing and services sector, which is set to be released on Thursday.
Daily Digest Market Movers: Australian Dollar receives support from the hawkish mood surrounding the RBA
- According to the CME FedWatch Tool, there is an 88.9% probability of a 25-basis-point rate cut, with no expectation of a larger 50-basis-point cut.
- Australia's Judo Bank Composite PMI slightly rose to 49.8 in October, up from 49.6 in September, signaling a second straight month of contraction in private sector output. The Services PMI inched up to 50.6 from 50.5, marking its ninth consecutive month of expansion, while the Manufacturing PMI dipped to 46.6 from 46.7, continuing its decline.
- In a post on the social media platform X, Federal Reserve Bank of San Francisco President Mary Daly stated that the economy is clearly in a better position, with inflation having fallen significantly and the labor market returning to a more sustainable path.
- On Monday, Federal Reserve Bank of Minneapolis President Neel Kashkari highlighted that the Fed is closely monitoring the US labor market for signs of rapid destabilization. Kashkari cautioned investors to anticipate a gradual pace of rate cuts over the coming quarters, suggesting that any monetary easing will likely be moderate rather than aggressive.
- The People's Bank of China (PBoC) reduced the 1-year Loan Prime Rate (LPR) to 3.10% from 3.35% and the 5-year LPR to 3.60% from 3.85%, in line with expectations. Lower borrowing costs are anticipated to stimulate China's domestic economic activity, potentially increasing demand for Australian exports.
- National Australia Bank revised its projection for the Reserve Bank of Australia (RBA) in a note last week. "We have brought forward our expectations for the timing of rate cuts, now anticipating the first cut in February 2025, instead of May," the bank stated. They continue to foresee gradual cuts, with rates expected to decrease to 3.10% by early 2026.
Technical Analysis: Australian Dollar remains below 0.6650, close to six-week lows
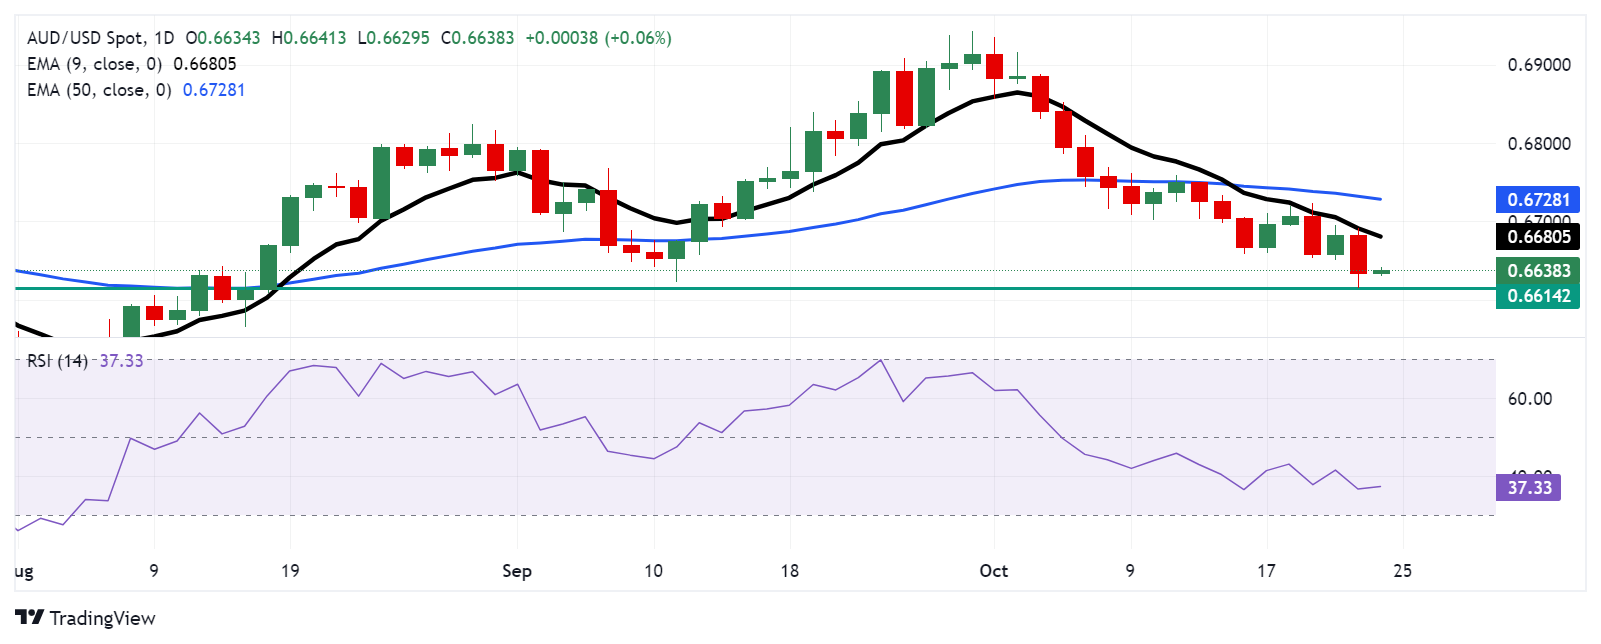
The AUD/USD pair trades around 0.6640 on Thursday. Technical analysis of the daily chart suggests a short-term bearish outlook as the pair remains below the nine-day Exponential Moving Average (EMA). Additionally, the 14-day Relative Strength Index (RSI) is below 50, reinforcing the bearish sentiment.
Regarding support, the AUD/USD pair could retest its two-month low of 0.6614, last seen on Wednesday. The next key support appears at the psychological level of 0.6600.
On the upside, resistance is expected at the nine-day EMA at 0.6680, followed by the 50-day EMA at 0.6728. A break above these levels could open the door for a potential move toward the psychological resistance of 0.6800.
AUD/USD: Daily Chart
Australian Dollar PRICE Today
The table below shows the percentage change of Australian Dollar (AUD) against listed major currencies today. Australian Dollar was the strongest against the US Dollar.
| USD | EUR | GBP | JPY | CAD | AUD | NZD | CHF | |
|---|---|---|---|---|---|---|---|---|
| USD | -0.09% | -0.05% | -0.30% | -0.11% | -0.16% | -0.15% | -0.04% | |
| EUR | 0.09% | 0.03% | -0.20% | -0.02% | -0.08% | -0.08% | 0.03% | |
| GBP | 0.05% | -0.03% | -0.26% | -0.06% | -0.12% | -0.12% | 0.00% | |
| JPY | 0.30% | 0.20% | 0.26% | 0.20% | 0.14% | 0.11% | 0.26% | |
| CAD | 0.11% | 0.02% | 0.06% | -0.20% | -0.04% | -0.05% | 0.07% | |
| AUD | 0.16% | 0.08% | 0.12% | -0.14% | 0.04% | 0.01% | 0.12% | |
| NZD | 0.15% | 0.08% | 0.12% | -0.11% | 0.05% | -0.01% | 0.12% | |
| CHF | 0.04% | -0.03% | -0.01% | -0.26% | -0.07% | -0.12% | -0.12% |
The heat map shows percentage changes of major currencies against each other. The base currency is picked from the left column, while the quote currency is picked from the top row. For example, if you pick the Australian Dollar from the left column and move along the horizontal line to the US Dollar, the percentage change displayed in the box will represent AUD (base)/USD (quote).
Economic Indicator
S&P Global Composite PMI
The S&P Global Composite Purchasing Managers Index (PMI), released on a monthly basis, is a leading indicator gauging US private-business activity in the manufacturing and services sector. The data is derived from surveys to senior executives. Each response is weighted according to the size of the company and its contribution to total manufacturing or services output accounted for by the sub-sector to which that company belongs. Survey responses reflect the change, if any, in the current month compared to the previous month and can anticipate changing trends in official data series such as Gross Domestic Product (GDP), industrial production, employment and inflation. The index varies between 0 and 100, with levels of 50.0 signaling no change over the previous month. A reading above 50 indicates that the private economy is generally expanding, a bullish sign for the US Dollar (USD). Meanwhile, a reading below 50 signals that activity is generally declining, which is seen as bearish for USD.
Read more.Next release: Thu Oct 24, 2024 13:45 (Prel)
Frequency: Monthly
Consensus: -
Previous: 54
Source: S&P Global
Author

Akhtar Faruqui
FXStreet
Akhtar Faruqui is a Forex Analyst based in New Delhi, India. With a keen eye for market trends and a passion for dissecting complex financial dynamics, he is dedicated to delivering accurate and insightful Forex news and analysis.


