Australian Dollar trims intraday gains ahead of US Jobless Claims
- Australian Dollar receives upward support after witnessing solid growth in the country’s exports.
- Australia's Trade Balance reached 9,640 million, surpassing market expectations of 8,725 million.
- US Dollar pulls back after the weaker employment data on Wednesday.


The Australian Dollar (AUD) retraces some of its intraday gains, continuing to trade higher from the previous session's close. The Aussie pair received upward support due to the correction in US Dollar (USD), following the decline in US Treasury yields.
Australia’s Bureau of Statistics revealed that Trade Balance data improved for the month of August, reflecting solid growth in Australian exports, which could underpin the Australian Dollar (AUD).
However, the AUD/USD pair could face challenges due to market caution regarding the US Federal Reserve's (Fed) interest rate trajectory. Moreover, the dovish stance taken by the Reserve Bank of Australia (RBA) in its policy decisions adds to the downward pressure on the Australian Dollar.
The US Dollar Index (DXY) corrects from an 11-month high after a downbeat US employment data on Wednesday, coupled with a pullback in the US Treasury yields. However, the initial bond sell-off pushed US yields to levels not witnessed in years, followed by a rebound. Investors will closely monitor the bond market, recognizing its pivotal role in driving financial markets.
Daily Digest Market Movers: Australian Dollar recovers due to correction in US Dollar amid Aussie Trade Balance improvement
- Australia's Trade Balance (MoM) showed improvement in August, reaching 9,640 million, surpassing market expectations of 8,725 million. July's reading stood at 8,039 million.
- RBA opted to maintain the status quo, leaving the current interest rate unchanged at 4.10% in the recent policy meeting on Tuesday.
- Australia’s central bank could go for a rate hike, with expectations pointing toward a peak of 4.35% by the end of the year. This projection aligns with the persistent elevation of inflation above the target.
- Michele Bullock, the newly appointed governor of the RBA, in her inaugural monetary policy statement following the interest rate decision, emphasized the need for additional tightening of monetary policy.
- Bullock noted that recent data align with the return of inflation to the target range. While inflation in Australia has peaked, it remains elevated and is expected to persist for a while.
- US ISM Services PMI declined from 54.5 to 53.6 in September, in line with expectations. The ADP Employment Change for September rose by 89,000, falling short of the market consensus of 153,000 and marking the lowest level since January 2021.
- The 10-year US Treasury yield has corrected from 4.88%, a level reached on Wednesday, which was the highest since 2007.
- Traders await the upcoming Jobless Claims and the Nonfarm Payrolls on Friday. Upbeat numbers could trigger more USD gains and increase volatility in the bond market.
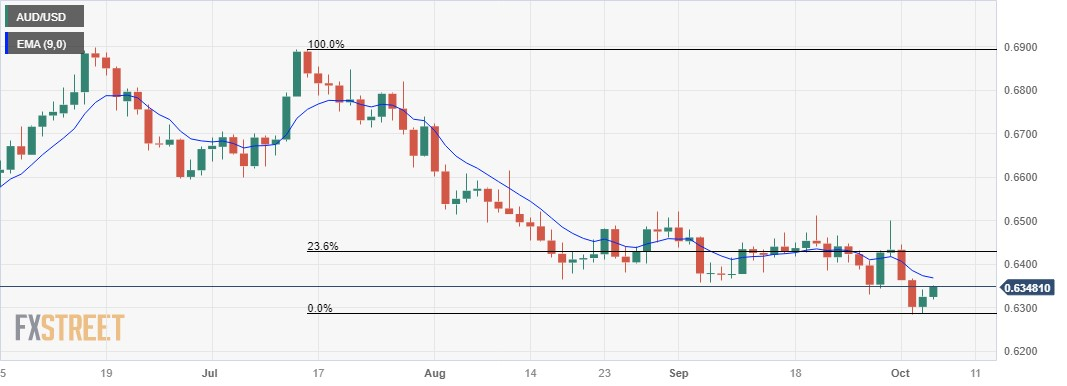
Technical Analysis: Australian Dollar hovers around 0.6350 psychological level, resistance at nine-day EMA
Australian Dollar trades around the major level at 0.6350 on Thursday. The nine-day Exponential Moving Average (EMA) at 0.6368 acts as a key barrier, following the region around 0.6400 psychological level. A firm break above the latter could open the doors for the pair to explore levels around the 23.6% Fibonacci retracement at 0.6428 level. On the downside, the major level at 0.6300 emerges as the immediate support, followed by November's low at 0.6272.
AUD/USD: Daily Chart
Australian Dollar price today
The table below shows the percentage change of the Australian Dollar (AUD) against listed major currencies today. The Australian Dollar was the strongest against the Pound Sterling.
| USD | EUR | GBP | CAD | AUD | JPY | NZD | CHF | |
| USD | -0.08% | 0.03% | 0.04% | -0.30% | 0.00% | -0.27% | 0.00% | |
| EUR | 0.08% | 0.12% | 0.12% | -0.22% | 0.07% | -0.19% | 0.08% | |
| GBP | -0.03% | -0.12% | 0.00% | -0.31% | -0.04% | -0.28% | -0.04% | |
| CAD | -0.04% | -0.12% | 0.00% | -0.33% | -0.04% | -0.31% | -0.04% | |
| AUD | 0.26% | 0.19% | 0.30% | 0.30% | 0.26% | 0.01% | 0.27% | |
| JPY | 0.00% | -0.07% | 0.05% | 0.03% | -0.27% | -0.27% | 0.00% | |
| NZD | 0.23% | 0.19% | 0.30% | 0.30% | -0.04% | 0.24% | 0.29% | |
| CHF | 0.01% | -0.08% | 0.03% | 0.05% | -0.30% | 0.01% | -0.23% |
The heat map shows percentage changes of major currencies against each other. The base currency is picked from the left column, while the quote currency is picked from the top row. For example, if you pick the Euro from the left column and move along the horizontal line to the Japanese Yen, the percentage change displayed in the box will represent EUR (base)/JPY (quote).
Economic Indicator
United States Initial Jobless Claims
The Initial Jobless Claims released by the US Department of Labor is a measure of the number of people filing first-time claims for state unemployment insurance. In other words, it provides a measure of strength in the labor market. A larger than expected number indicates weakness in this market which influences the strength and direction of the US economy. Generally speaking, a decreasing number should be taken as positive or bullish for the USD.
Read more.Why it matters to traders
Every Thursday, the US Department of Labor publishes the number of previous week’s initial claims for unemployment benefits in the US. Since this reading could be highly volatile, investors may pay closer attention to the four-week average. A downtrend is seen as a sign of an improving labor market and could have a positive impact on the USD’s performance against its rivals and vice versa.
Author
Akhtar Faruqui
FXStreet
Akhtar Faruqui is a Forex Analyst based in New Delhi, India. With a keen eye for market trends and a passion for dissecting complex financial dynamics, he is dedicated to delivering accurate and insightful Forex news and analysis.
















