Australian Dollar appreciates as US Dollar pares gains due to improved risk sentiment
- AUD/USD recovers its intraday losses following the release of China Trade Balance data.
- China's Trade Balance increased to CNY 649.34 billion in August, from the previous reading of CNY 601.90 billion.
- The US Dollar received support as recent labor data reduced the likelihood of an aggressive Fed rate cut in September.

The AUD/USD pair gained ground after the release of China's Trade Balance data on Tuesday. However, the Australian Dollar (AUD) faced challenges against the US Dollar (USD) following the downbeat Westpac Consumer Confidence.
Additionally, the AUD/USD pair faced challenges as the US Dollar received support as a recent US labor market report raised uncertainty over the likelihood of an aggressive interest rate cut by the Federal Reserve (Fed) at its September meeting.
China's Trade Balance reported a trade surplus of CNY 649.34 billion for August, increasing from the previous reading of CNY 601.90 billion. Meanwhile, China's Exports (CNY) increased by 8.4% year-on-year, following the previous rise of 6.5%.
Australia's Westpac Consumer Confidence fell by 0.5% month-on-month in September, swinging from a 2.8% gain in August. Traders await China’s Trade Balance data scheduled to be released later in the day. Given the close trade relationship between Australia and China, any changes in the Chinese economy could have a significant impact on Australian markets.
Daily Digest Market Movers: Australian Dollar extends decline due to increasing risk aversion
- According to the CME FedWatch Tool, markets are fully anticipating at least a 25 basis point (bps) rate cut by the Federal Reserve at its September meeting. The likelihood of a 50 bps rate cut has slightly decreased to 29.0%, down from 30.0% a week ago.
- China’s Consumer Price Index (CPI) rose by 0.6% year-on-year in August, up from 0.5% in July but below the market consensus of 0.7%. On a monthly basis, CPI inflation increased by 0.4% in August, down from 0.5% in July and worse than the 0.5% estimate.
- RBC Capital Markets now expects the Reserve Bank of Australia to implement a rate cut at its February 2025 meeting, earlier than its previous forecast of May 2025. Despite inflation in Australia remaining elevated above the RBA's target, slower economic growth is not considered a sufficient reason for a rate cut this year.
- The US Bureau of Labor Statistics (BLS) reported that Nonfarm Payrolls (NFP) added 142,000 jobs in August, below the forecast of 160,000 but an improvement from July’s downwardly revised figure of 89,000. Meanwhile, the Unemployment Rate fell to 4.2%, as expected, down from 4.3% in the previous month.
- Federal Reserve (Fed) Bank of Chicago President Austan Goolsbee remarked on Friday that Fed officials are starting to align with the broader market's sentiment that a policy rate adjustment by the US central bank is imminent, according to CNBC. FXStreet’s FedTracker, which uses a custom AI model to evaluate Fed officials' speeches on a dovish-to-hawkish scale from 0 to 10, rated Goolsbee's comments as dovish, assigning them a score of 3.2.
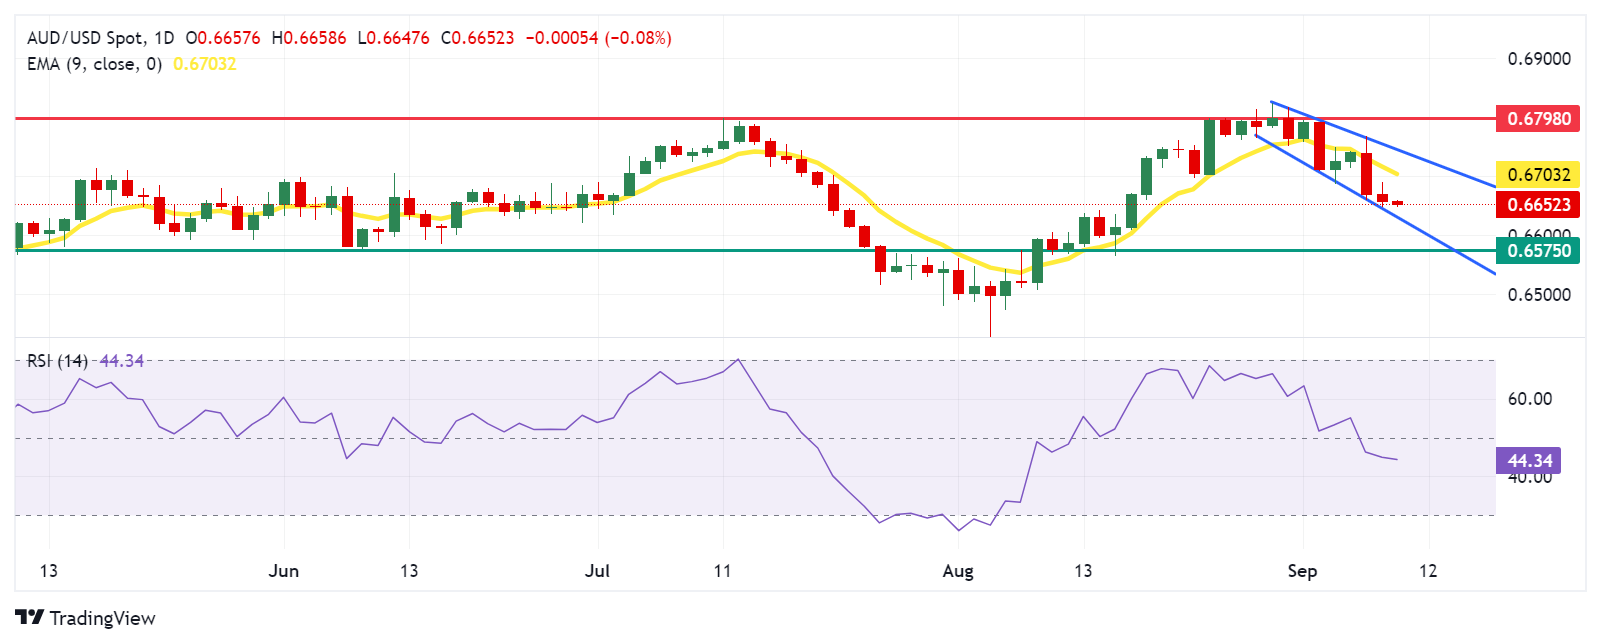
Technical Analysis: Australian Dollar tests 0.6650 near the lower boundary of descending channel
The AUD/USD pair trades around 0.6650 on Tuesday. The daily chart analysis shows that the pair is trekking down along the lower boundary of the descending channel, suggesting the reinforcing of a bearish bias. Additionally, the 14-day Relative Strength Index (RSI) falls below the 50 level, confirming the ongoing bearish trend for the AUD/USD pair.
On the downside, the AUD/USD pair targets the lower boundary of the descending channel around the level of 0.6630. A break below this level could strengthen the bearish bias and lead the pair to navigate the region around the throwback support at 0.6575.
Regarding resistance, the AUD/USD pair may find the barrier around the nine-day Exponential Moving Average (EMA) at the 0.6703 level. A breakthrough above this level could weaken the bearish bias and support the AUD/USD pair to test the upper boundary of the descending channel around the 0.6750 level, followed by a seven-month high of 0.6798, reached on July 11.
AUD/USD: Daily Chart
Australian Dollar PRICE Today
The table below shows the percentage change of Australian Dollar (AUD) against listed major currencies today. Australian Dollar was the strongest against the Canadian Dollar.
| USD | EUR | GBP | JPY | CAD | AUD | NZD | CHF | |
|---|---|---|---|---|---|---|---|---|
| USD | -0.01% | -0.06% | -0.03% | 0.04% | -0.11% | -0.11% | -0.15% | |
| EUR | 0.01% | -0.04% | 0.00% | 0.04% | -0.11% | -0.14% | -0.14% | |
| GBP | 0.06% | 0.04% | 0.02% | 0.05% | -0.06% | -0.10% | -0.08% | |
| JPY | 0.03% | 0.00% | -0.02% | 0.04% | -0.10% | -0.13% | -0.14% | |
| CAD | -0.04% | -0.04% | -0.05% | -0.04% | -0.16% | -0.15% | -0.18% | |
| AUD | 0.11% | 0.11% | 0.06% | 0.10% | 0.16% | -0.01% | -0.03% | |
| NZD | 0.11% | 0.14% | 0.10% | 0.13% | 0.15% | 0.01% | -0.01% | |
| CHF | 0.15% | 0.14% | 0.08% | 0.14% | 0.18% | 0.03% | 0.01% |
The heat map shows percentage changes of major currencies against each other. The base currency is picked from the left column, while the quote currency is picked from the top row. For example, if you pick the Australian Dollar from the left column and move along the horizontal line to the US Dollar, the percentage change displayed in the box will represent AUD (base)/USD (quote).
RBA FAQs
The Reserve Bank of Australia (RBA) sets interest rates and manages monetary policy for Australia. Decisions are made by a board of governors at 11 meetings a year and ad hoc emergency meetings as required. The RBA’s primary mandate is to maintain price stability, which means an inflation rate of 2-3%, but also “..to contribute to the stability of the currency, full employment, and the economic prosperity and welfare of the Australian people.” Its main tool for achieving this is by raising or lowering interest rates. Relatively high interest rates will strengthen the Australian Dollar (AUD) and vice versa. Other RBA tools include quantitative easing and tightening.
While inflation had always traditionally been thought of as a negative factor for currencies since it lowers the value of money in general, the opposite has actually been the case in modern times with the relaxation of cross-border capital controls. Moderately higher inflation now tends to lead central banks to put up their interest rates, which in turn has the effect of attracting more capital inflows from global investors seeking a lucrative place to keep their money. This increases demand for the local currency, which in the case of Australia is the Aussie Dollar.
Macroeconomic data gauges the health of an economy and can have an impact on the value of its currency. Investors prefer to invest their capital in economies that are safe and growing rather than precarious and shrinking. Greater capital inflows increase the aggregate demand and value of the domestic currency. Classic indicators, such as GDP, Manufacturing and Services PMIs, employment, and consumer sentiment surveys can influence AUD. A strong economy may encourage the Reserve Bank of Australia to put up interest rates, also supporting AUD.
Quantitative Easing (QE) is a tool used in extreme situations when lowering interest rates is not enough to restore the flow of credit in the economy. QE is the process by which the Reserve Bank of Australia (RBA) prints Australian Dollars (AUD) for the purpose of buying assets – usually government or corporate bonds – from financial institutions, thereby providing them with much-needed liquidity. QE usually results in a weaker AUD.
Quantitative tightening (QT) is the reverse of QE. It is undertaken after QE when an economic recovery is underway and inflation starts rising. Whilst in QE the Reserve Bank of Australia (RBA) purchases government and corporate bonds from financial institutions to provide them with liquidity, in QT the RBA stops buying more assets, and stops reinvesting the principal maturing on the bonds it already holds. It would be positive (or bullish) for the Australian Dollar.
Author

Akhtar Faruqui
FXStreet
Akhtar Faruqui is a Forex Analyst based in New Delhi, India. With a keen eye for market trends and a passion for dissecting complex financial dynamics, he is dedicated to delivering accurate and insightful Forex news and analysis.


