Aurora Cannabis (ACB) Stock Price and Forecast: Rollercoaster for getting high!
- ACB stock split in May, had big revenue growth in 2020.
- Hopes grow for US legalization of cannabis under the Biden administration.
- Volatile stock with lots of retail interest, bullish trend goes on.

Aurora Cannabis (ACB) had a rollercoaster 2020. In May ACB announced a stock split. ACB also published results in May, which beat expectations. Aurora (ACB), a Canadian based cannabis producer based in Edmonton, Canada, announced revenue growth of over 20% as the pandemic lockdowns increased sales of marijuana. ACB stock surged nearly 70% after results to hit a high of nearly $20 on May 18.
ACB stock price: Too high!
However, that rally was as good as it got in 2020 for ACB, as it gradually gave up all the gains and by the end of October ACB stock price was trading back below $5. ACB has been on a rationalization drive, appointing a new CEO, reducing its cost base and capital spending. ACB announced in September that it would have to take a significant non-cash write-down of goodwill and intangible assets.
Let’s get high again
November was a different story as ACB rallied nearly 200% to hit a high of $14.48. The victory of Joe Biden in the US presidential election was seen as a catalyst for cannabis reform in the US, as well as some legislation passing the first stage towards making cannabis legal.
Aurora (ACB) is a very volatile stock with a lot of retail interest. As a result, it tends to react to news pieces aggressively. Last Thursday, ACB announced a distribution deal and ACB stock price rallied 10%. ACB gave up those gains during the next session.
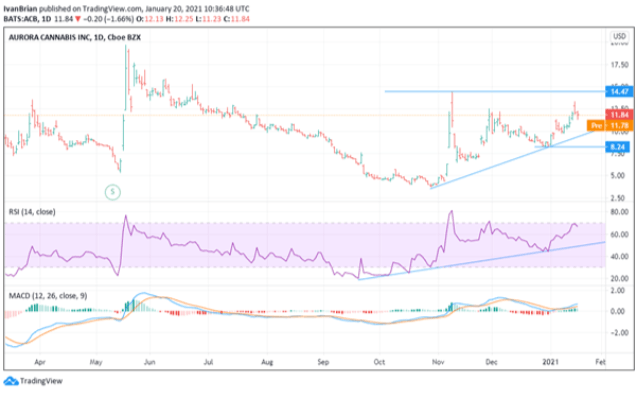
ACB technical analysis
Smaller stocks with large swings make technical analysis a bit more challenging as euphoria and despair can blast through any technical levels. But ACB currently still holds its bullish trend with the classic series of higher lows and higher highs, which are backed up with the RSI and MACD uptrends. A break of $8.21 would mean the end of the uptrend pattern. The $14.47 high remains key resistance.
The author has no position in any stock mentioned in this article and no business relationship with any company mentioned. The author has received compensation for writing this article. The author and FXStreet are not registered investment advisors and nothing in this article is intended to be investment advice. It is important to do your own research before making any investment and take independent advice from a registered investment advisor. This article is for information purposes only. We/I do not provide personalized recommendations. I make no representations as to accuracy, completeness, the suitability of this information. I will not be liable for any errors, omissions or any losses, injuries or damages arising from this information display or use. I will not be held responsible for information that is found at the end of links posted on this page.
Author

Ivan Brian
FXStreet
Ivan Brian started his career with AIB Bank in corporate finance and then worked for seven years at Baxter. He started as a macro analyst before becoming Head of Research and then CFO.


