|

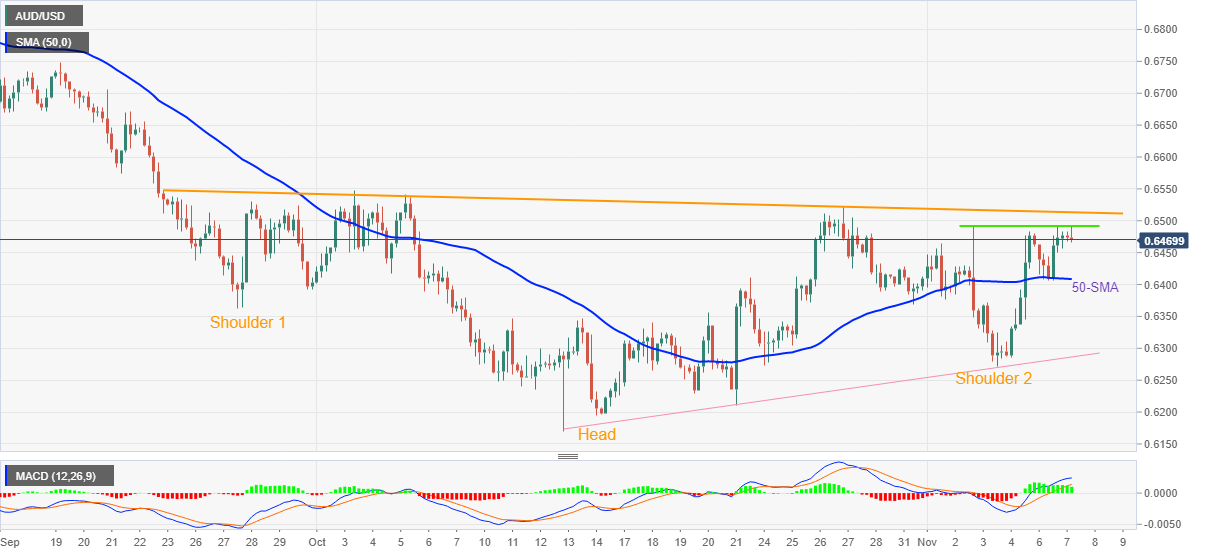
AUDUSD Price Analysis: Eases below 0.6500, inverse H&S in focus

  • AUDUSD retreats from one-week-old horizontal resistance but keeps bullish Head-And-Shoulders formation intact.
  • 50-SMA defends buyers before the latest swing low, bullish MACD signals favor upside momentum.
  • Sustained break of 0.6515 appears necessary to confirm a rally.

AUDUSD snaps a two-day uptrend as it refreshes intraday low near 0.6470 during early Tuesday in Asia.

That said, the Aussie pair’s latest weakness could be linked to the quote’s failure to cross a one-week-old horizontal resistance near 0.6495-90.

However, the inverse Head-And-Shoulders bullish chart pattern joins the upbeat MACD signals to keep the AUDUSD buyers hopeful.

Even so, a successful break of the stated bullish chart pattern’s neckline, near 0.6515, appears necessary for the bulls to aim for September’s high near 0.6920. It should be noted that multiple hurdles surrounding 0.6550 could test the AUDUSD bulls between 0.6920 and 0.6515.

On the flip side, a sustained break of the 50-SMA support, around 0.6405 by the press time, becomes necessary for the AUDUSD bear’s conviction.

Following that, a one-month-old ascending support line, near 0.6285, will precede the monthly low near 0.6270 and the yearly bottom surrounding 0.6170 could gain the market’s attention.

Overall, AUDUSD remains on the bull’s radar but a clear break of 0.6515 appears necessary for the pair buyers to cheer the recent advances.

AUDUSD: Four-hour chart

Trend: Further upside expected

Additional important levels

Overview
Today last price0.6472
Today Daily Change-0.0007
Today Daily Change %-0.11%
Today daily open0.6479
 
Trends
Daily SMA200.6351
Daily SMA500.6522
Daily SMA1000.6719
Daily SMA2000.6969
 
Levels
Previous Daily High0.6491
Previous Daily Low0.6406
Previous Weekly High0.6493
Previous Weekly Low0.6272
Previous Monthly High0.6548
Previous Monthly Low0.617
Daily Fibonacci 38.2%0.6458
Daily Fibonacci 61.8%0.6439
Daily Pivot Point S10.6427
Daily Pivot Point S20.6375
Daily Pivot Point S30.6343
Daily Pivot Point R10.6511
Daily Pivot Point R20.6543
Daily Pivot Point R30.6595

Author

Anil Panchal

Anil Panchal

FXStreet

Anil Panchal has nearly 15 years of experience in tracking financial markets. With a keen interest in macroeconomics, Anil aptly tracks global news/updates and stays well-informed about the global financial moves and their implications.

More from Anil Panchal
Share:

Editor's Picks

EUR/USD holds losses near 1.1850 as US, China holidays keep trade muted

EUR/USD opens the week on a softer note, trading near 1.1860 during the Asian session on Monday. Activity is likely to remain muted, with United States markets closed for the Presidents’ Day holiday, while Mainland China is also shut for the week-long Lunar New Year break.

GBP/USD flat lines as traders await key UK macro data and FOMC minutes

The GBP/USD pair kicks off a new week on a subdued note and oscillates in a narrow range, just below mid-1.3600s, during the Asian session. Moreover, the mixed fundamental backdrop warrants some caution for aggressive traders as the market focus now shifts to this week's important releases from the UK and the US.

Gold remains below $5,050 despite Fed rate cut bets, uncertain geopolitical tensions

Gold edges lower after registering over 2% gains in the previous session, trading around $5,030 per troy ounce during the Asian hours on Monday. However, the non-interest-bearing Gold could further gain ground following softer January Consumer Price Index figures, which reinforced expectations that the Federal Reserve could cut rates later this year.

Top Crypto Losers: Dogecoin, Zcash, Bonk – Meme and Privacy coins under pressure

Meme coins such as Dogecoin and Bonk, alongside the privacy coin Zcash (ZEC), are leading the broader market losses over the last 24 hours. DOGE, ZEC, and BONK ended their three consecutive days of recovery with a sudden decline on Sunday, as crucial resistance levels capped the gains. Technically, the altcoins show downside risk, starting the week under pressure.

Global inflation watch: Signs of cooling services inflation

Realized inflation landed close to expectations in January, as negative base effects weighed on the annual rates. Remaining sticky inflation is largely explained by services, while tariff-driven goods inflation remains limited even in the US.

Ripple Price Forecast: XRP potential bottom could be in sight

Ripple edges up above the intraday low of $1.35 at the time of writing on Friday amid mixed price actions across the crypto market. The remittance token failed to hold support at $1.40 the previous day, reflecting risk-off sentiment amid a decline in retail and institutional sentiment.