|

AUDJPY Price Analysis: Plunges from monthly highs, struggles to reclaim the 100-DMA

  • AUD/JPY retraces from weekly highs, set to end the week with minimal losses of 0.07%.
  • Japanese authorities intervened in the FX market to bolster the Japanese yen.
  • AUD/JPY Price Forecast: From the daily, the pair is neutral-to-upwards, but short term, is range-bound, so caution is warranted.

The AUD/JPY seesawed in a wide range following Japanese authorities’ intervention in the FX markets. The risk-perceived cross pair hit a daily high at around 95.73 before plunging toward its daily low at 93.08. At the time of writing, the AUD/JPY is trading at 93.80, below its opening price by 0.49%.

AUD/JPY Price Forecast

Friday’s session was volatile, and the AUD/JPY shifted its bias from neutral upwards to neutral, as flashed by the daily chart. When the pair fell from daily highs, it hurdled the 50 and 100-day Exponential Moving Averages (EMAs), each at 94.57 and 94.20, exposing the 20-day EMA. Worth noting that the AUD/JPY pierced the latter around 93.22 but rebounded towards current exchange rates, keeping the pair range-bound.

Due to market participants bracing for the weekend, the lack of catalyst might keep the AUD/JPSD trading within the boundaries imposed by the daily EMAs. Therefore, key resistance lies at the 100 and 50-EMAs at 94.20 and 94.57, ahead of the 95.00 figure. On the flip side, the AUD/JPY first support would be the 20-day EMA at 93.22, ahead of the weekly low at 93.08.

AUD/JPY Daily Chart

Short term, the AUD/JPY hourly chart, lacks direction, so traders better be on the sidelines until the dust settles. For the restless ones, the AUD/JPY first resistance is the daily pivot point at 94.27, followed by the 95.00 figure, ahead of the R2 pivot level at 95.16. On the flip side, the AUD/JPY key support levels would be the 94.00 figure, followed by the S1 daily pivot at 93.86, ahead of the 200-EMA at 93.18.

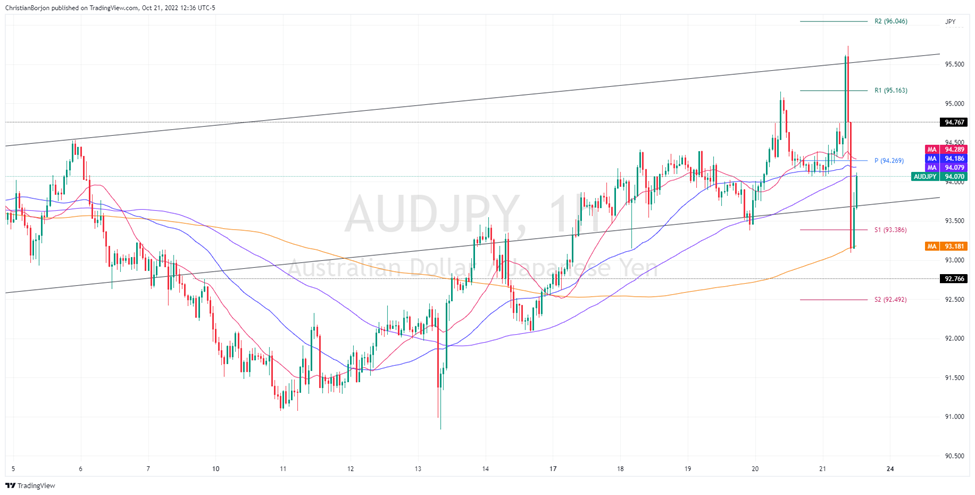
AUD/JPY Hourly Chart

AUD/JPY Key Technical Levels

AUD/JPY

Overview
Today last price94
Today Daily Change-0.31
Today Daily Change %-0.33
Today daily open94.31
 
Trends
Daily SMA2093.23
Daily SMA5094.62
Daily SMA10094.24
Daily SMA20091.06
 
Levels
Previous Daily High95.16
Previous Daily Low93.38
Previous Weekly High93.55
Previous Weekly Low90.84
Previous Monthly High98.58
Previous Monthly Low92.13
Daily Fibonacci 38.2%94.48
Daily Fibonacci 61.8%94.06
Daily Pivot Point S193.4
Daily Pivot Point S292.5
Daily Pivot Point S391.62
Daily Pivot Point R195.19
Daily Pivot Point R296.06
Daily Pivot Point R396.97

Author

Christian Borjon Valencia

Markets analyst, news editor, and trading instructor with over 14 years of experience across FX, commodities, US equity indices, and global macro markets.

More from Christian Borjon Valencia
Share:

Editor's Picks

EUR/USD weakens below 1.1700 as Middle East tensions drive US Dollar strength

The EUR/USD pair trades with mild losses around 1.1685, the lowest since late January, during the early Asian session on Tuesday. The US Dollar gathers strength against the Euro as escalating tensions in the Middle East boost safe-haven currencies. The preliminary reading of the Harmonized Index of Consumer Prices from the Eurozone will be published later on Tuesday.  

GBP/USD hovers around 1.3400 with bearish pressure intact

GBP/USD edges higher after three days of losses, trading around 1.3400 during the Asian hours on Tuesday. The technical analysis of the daily chart indicates an ongoing bearish bias, as the pair trades within a descending channel pattern.

Gold defends bids as US-Iran war continues to fuel safe-haven flows

Gold retains positive bias for the fifth consecutive day on Tuesday as rising geopolitical tensions in the Middle East continue to underpin safe-haven assets. However, a bullish US Dollar keeps the bullion below its highest level since late January, set on Monday, warranting caution before positioning for any further appreciation.

Strategy lifts holdings to 3.4% of Bitcoin's total supply amid inflows into crypto products

Strategy continued its accumulation of the top crypto last week, acquiring 3,015 BTC for $204 million amid renewed interest in crypto products after four weeks of outflows.

The market is not panicking it is repricing the probability distribution of Oil and time

At the end of the day, markets do not trade morality or geopolitics. They trade transmission channels. And the only channel that truly matters in this maelstrom runs through the price of energy and the time value of money.

Grass 20% bullish breakout defies broader market weakness

Grass (GRASS) is edging up above $0.30 at the time of writing on Monday. The token’s notable 20% intraday surge stands out amid heightened volatility in the broader crypto market.