|

AUD/USD Technical Analysis: Aussie erases RBA-inspired losses
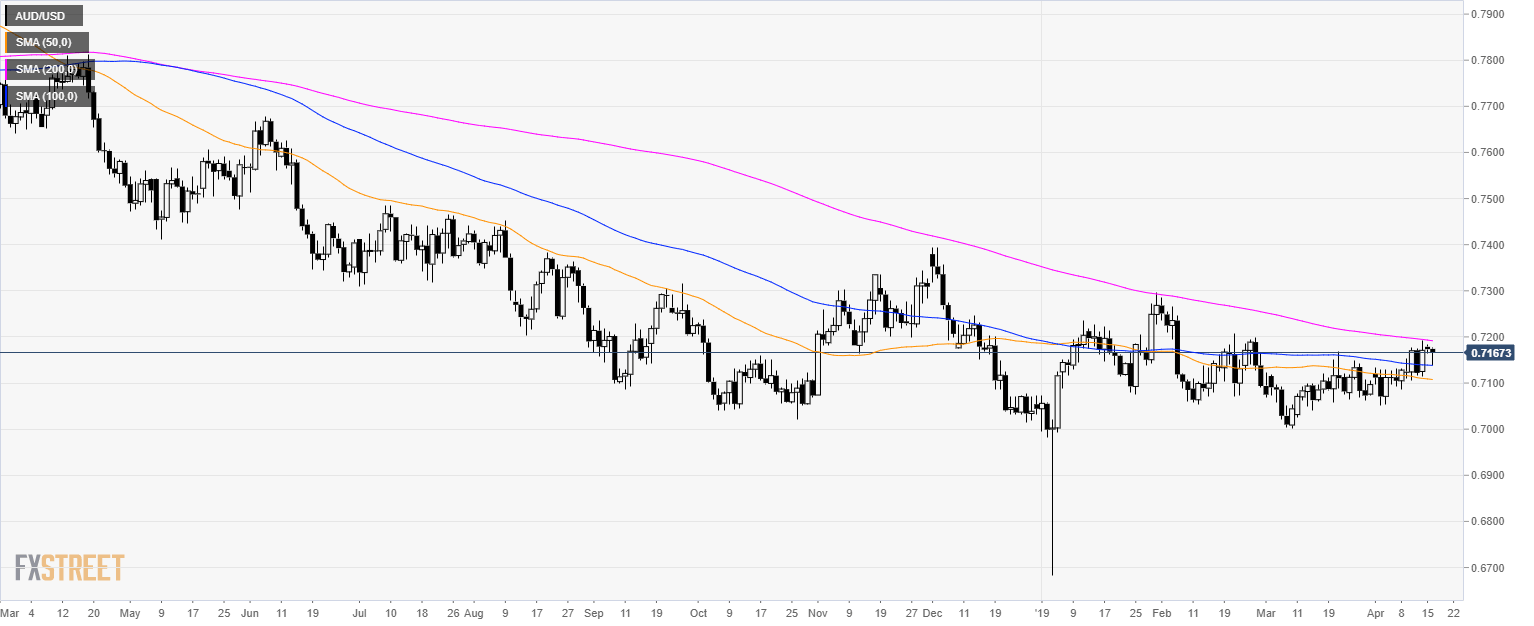
AUD/USD daily chart

  • AUD/USD is trading in a bear trend below its 200-day simple moving averages (SMA). 
  • The Aussie dropped sharply in the Asian session on the back of a dovish Reserve Bank of Australia (RBA). This was seen as bearish for the AUD.

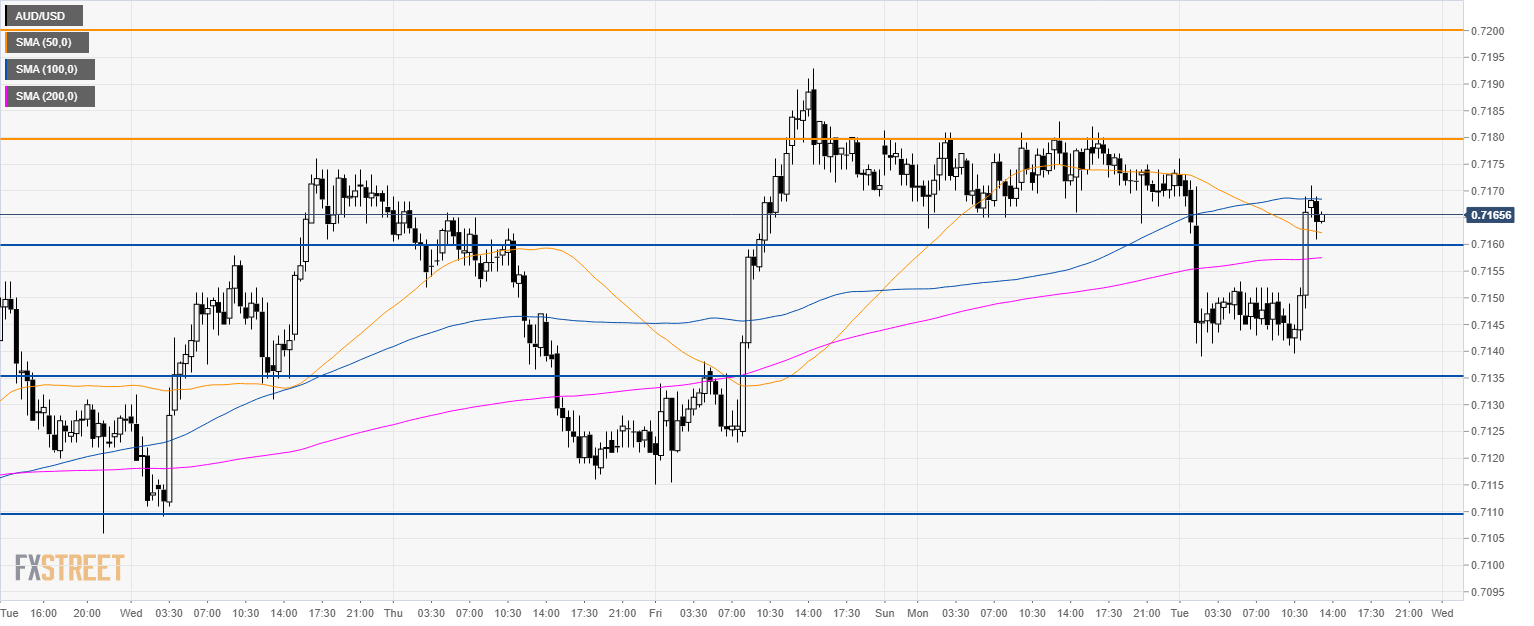
AUD/USD 4-hour chart

  • AUD/USD is trading above its main SMAs suggesting a bullish bias in the medium-term.

AUD/USD 30-minute chart

  • AUD/USD found support just above 0.7135. This was a support mentioned yesterday.
  • AUD/USD is expected to consolidate between 0.7135 and 0.7180 for the time being.
  • The key resistance to the upside becomes 0.7180 level.

Additional key levels

AUD/USD

Overview
Today last price0.7166
Today Daily Change-0.0008
Today Daily Change %-0.11
Today daily open0.7174
 
Trends
Daily SMA200.7115
Daily SMA500.7109
Daily SMA1000.7139
Daily SMA2000.7193
Levels
Previous Daily High0.7183
Previous Daily Low0.7163
Previous Weekly High0.7193
Previous Weekly Low0.7087
Previous Monthly High0.7168
Previous Monthly Low0.7002
Daily Fibonacci 38.2%0.7171
Daily Fibonacci 61.8%0.7175
Daily Pivot Point S10.7163
Daily Pivot Point S20.7153
Daily Pivot Point S30.7143
Daily Pivot Point R10.7183
Daily Pivot Point R20.7193
Daily Pivot Point R30.7203

Author

Flavio Tosti

Flavio Tosti

Independent Analyst


More from Flavio Tosti
Share:

Editor's Picks

EUR/USD extends its optimism past 1.1900

EUR/USD retains a firm underlying bid, surpassing the 1.1900 mark as the NA session draws to a close on Monday. The pair’s persistent uptrend comes as the US Dollar remains on the defensive, with traders staying cautious ahead of upcoming US NFP prints and CPI data.
 

GBP/USD tilts bullish as markets barrel toward mid-week NFP print

GBP/USD is holding a broader bullish structure on the daily chart, with price trading well above the 50 Exponential Moving Average at 1.3507 and the 200 EMA at 1.3310, confirming the intermediate uptrend that has been in place since the November 2025 low near 1.2300. 

Gold pushes back above $5,000

The daily chart shows spot Gold in a parabolic uptrend that accelerated sharply from the $4,600 area in late January, printing a record high at $5,598.25 before a violent reversal erased nearly $1,000 in value during the final days of the month. 

Litecoin eyes $50 as heavy losses weigh on investors

Following a strong downtrend across the crypto market over the past week, Litecoin holders are under immense pressure. The Bitcoin fork has trimmed about $1.81 billion from its market capitalization since the beginning of the year, sending it below the top 20 cryptos by market cap.

Japanese PM Takaichi nabs unprecedented victory – US data eyed this week

I do not think I would be exaggerating to say that Japanese Prime Minister Sanae Takaichi’s snap general election gamble paid off over the weekend – and then some. This secured the Liberal Democratic Party (LDP) an unprecedented mandate just three months into her tenure.

Ripple exposed to volatility amid low retail interest, modest fund inflows

Ripple (XRP) is extending its intraday decline to around $1.40 at the time of writing on Monday amid growing pressure from the retail market and risk-off sentiment that continues to keep investors on the sidelines.